Graphical View
Once you click on the Generate button after configuring a report, its graphical view opens.
The visual presentation of the reports can be generated in
Bar chart
Line chart
Pie chart
Click on the chart icon and select the chart type you want to view the report in.

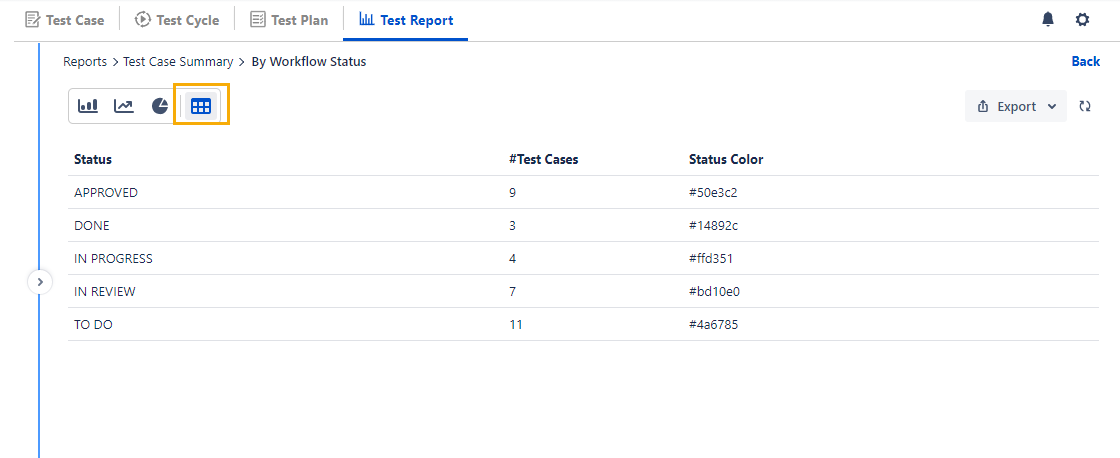
Tabular View
You can also view the report in tabular form. The tabular view provides information in rows and columns. Click on the table icon to view the report in tabular format.
Export Report
For every report available, you have the option of exporting it if you want to drill down the report. It gives detailed information related to the report. The exported report is in Excel sheets and can be used for sharing the reports.
You can export the gadget in Excel by clicking on the export drop-down.
Reports can be exported using the following options:
With steps: The exported report contains all Test Steps for all Test Cases in the selected Test Cycle.
Without steps: The exported report contains only the list of Test Cases in the selected Test Cycle.

If the records in the report that is being exported exceeds the limit of 1000, then this report will not get downloaded but will be emailed to the registered email address. Refer to this article in case you do not receive an exported report on your registered email address.