Exploratory Testing
- Mrunalini Potnis
Analytics
Benefits of QMetry Exploratory Testing Add-on
- QMetry Exploratory Testing helps users identify problems with the website/application under test. The add-on verifies the website through a browser to confirm that it is functioning properly.
- The functionality traces actions performed during Exploratory UI testing in browser, and converts it into modular code that can be used for automated regression Tests.
- Each event and navigation are recorded, which provides ready-to-use Automated Documentation.
- The tool allows its users to log issues just on a mouse click. It enables users to add visuals while logging issues, which makes it easy for development team to catch the scenario where the application fails.
All the features intend to generate precise and clear communication, which lessens the chances of confusion and enhances the productivity of resources.
Install QMetry Exploratory Testing add-on and get started recording the events you perform on applications/websites. View results of these recorded sessions on QMetry Exploratory Testing instance.
Steps to initiate Exploratory Testing using QMetry Exploratory Testing
Step 1. Install QMetry Exploratory Testing chrome extension.
Step 2. Generate API Key in QMetry Test Management to log into the extension.
Step 3. Start exploratory testing and recording sessions through QMetry Exploratory Testing.
Pre-requisites:
To perform exploratory testing, users should have the "Modify" rights for the Exploratory Testing module.
Users with the "View" rights can only view the recorded sessions for the project.
How to install QMetry Exploratory Testing add-on
If you are using the Exploratory Testing module very first time, then go to Automation > Exploratory Testing. Click on the Install QMetry Exploratory Testing button.
As an alternate, click on the link below to open QMetry Exploratory Testing page in Chrome web store.
https://chrome.google.com/webstore/detail/qmetry-test-management-ex/jbnnldpbnobjfgodglhdlbdigibhoacn
Click on the ADD TO CHROME button on the top right corner to download QMetry Exploratory Testing Chrome extension.
Once the extension is added to your chrome browser, it will appear like below.

Log into QMetry Exploratory Testing
Open the Chrome browser.
Click on the QMetry Exploratory Testing icon at right.
If you are using QMetry Exploratory Testing add-on for the first time, then provide -
- QMetry URL: This is your QMetry Test Management instance.
- API Key: Generate the API Key in QMetry Test Management (from Exploratory Testing > Exploratory API) and enter the same in this field.
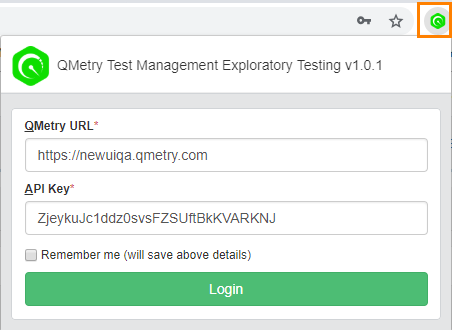
Click on the Login button.
Exploratory Testing (Record)
Users can record test sessions using QMetry Exploratory Testing add-on. These sessions will be recorded and stored in QMetry Test Management instance that you mentioned while logging into the add-on.
Record while you Explore
Once you log into QMetry Exploratory Testing, the next window opens asking for details on the test session/test scenario.
- Project: Select the Project in QMetry Test Management for which you want to conduct exploratory testing.
- Name: Enter the session name by which the test session/test scenario will be identified.
- Platform: Mention the Platform against which the test scenario is to be executed.
- Tags:You can tag the session to categorize it. You can create multiple tags for a session e.g., Import, Export, Integration.
- Extra Notes: Enter required notes or comments here in the text box.
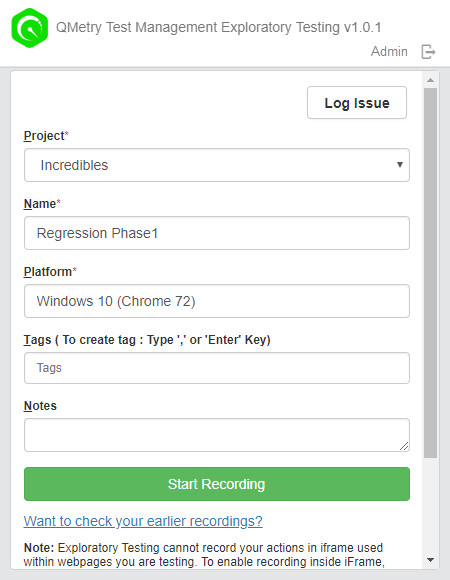
Click on the Start Recording button to initiate the recording of your actions on the website or application.
Note: It is recommended that you open the site you want to explore before you start recording.
The icon beside the address bar indicates that the recording is now in-progress.

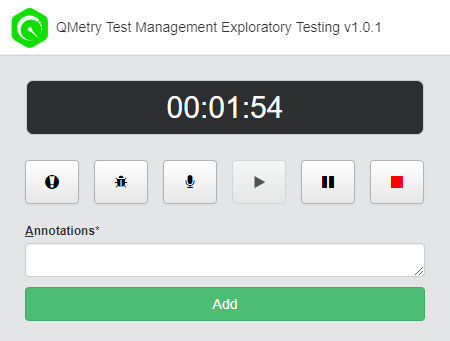
You can add Bugs/Issues, Audio and Annotations to your current recording.
Audio Recording
You can add a voice-over to the recording by clicking on the  icon.
icon.
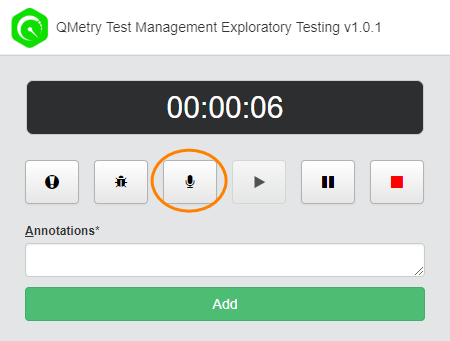
The icon is started displaying beside the address bar.

When you are done with audio recording, click on the icon at the right of the address bar.
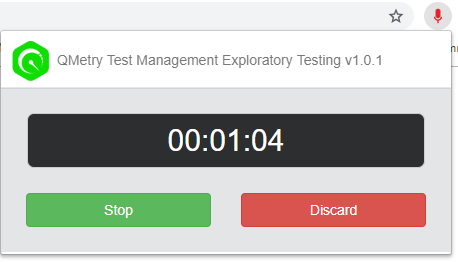
It displays the stopwatch. Click on the Stop button to stop audio recording.
To cancel the audio recording, click on the Discard button.
How to play the audio recording?
- Open the test scenario/session to which the audio recording was attached.
- Open the Document tab.
- You can see the Audio Recordings on the screen.
- Play the recorded audio. You can also download the recordings.

Assertions
User can use Assertion to get confirmation on existence of particular components on the website, for example, a particular button, text, etc.
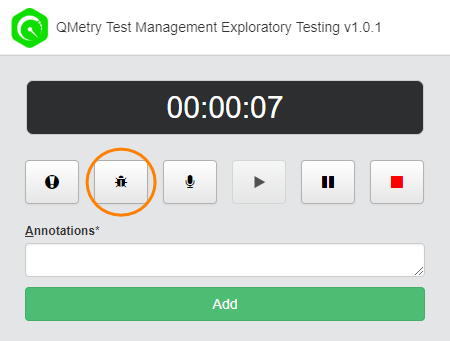
During the on-going recording session, if you find some important components on the website that you can not avoid, then click on the Start Assertion button. It will enable the as
Once you are done clicking on that element or selecting the text for assertion, and then click on the Assertion button again to stop its functionality.
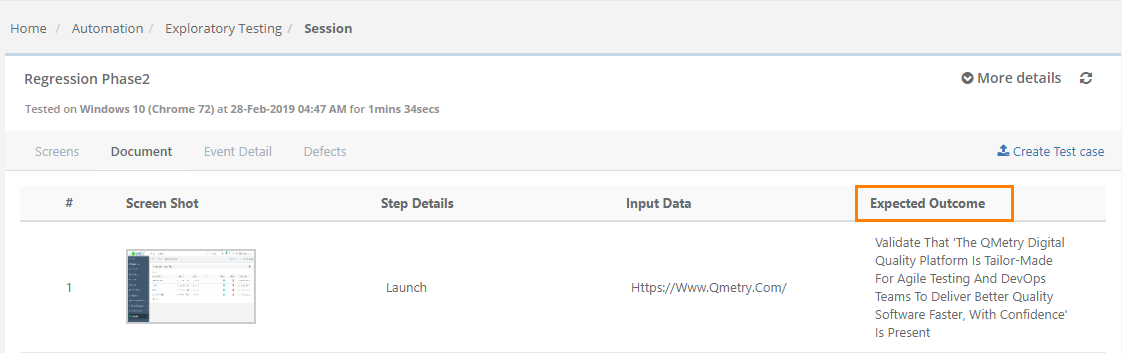
When you view the recorded sessions, all the Assertions will be displayed as Expected Outcome.
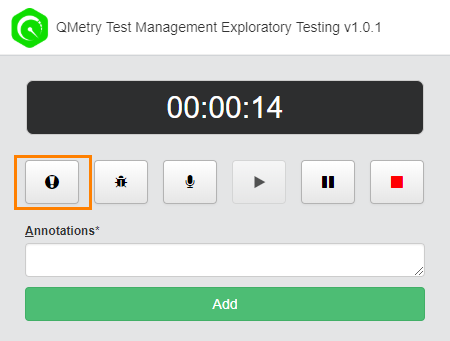
On the QMetry Exploratory Testing Extension -
- Annotations: Annotations can be added while recording the test session. Enter annotation and click Add.
- Pause: Click on the
 icon to pause the session recording for the time being. You can resume the recording at your convenience.
 - Play: Click on the Play icon
 to resume the test recording from where it was paused.
 - Stop: Click on the
 icon to stop the session recording. The uploading will start on stopping the session recording.
Log Issues
Log Issues while Recording
You can log issue to the scenario while recording the test session. The issue gets logged into JIRA.
Note: The logging issue operation will pause your session for a while. If you wish to resume the session, then close the issue logging screen after logging the issue.
- Click on the Bug icon
 .
. - The screenshot of current page opens in a separate tab.
- The page also have options like any other image editor.
Annotating Screenshot: You can annotate the screenshot you captured using the features available on the editor. It allows to describe any bug or issue more precisely, which ultimately makes it more comprehensive.
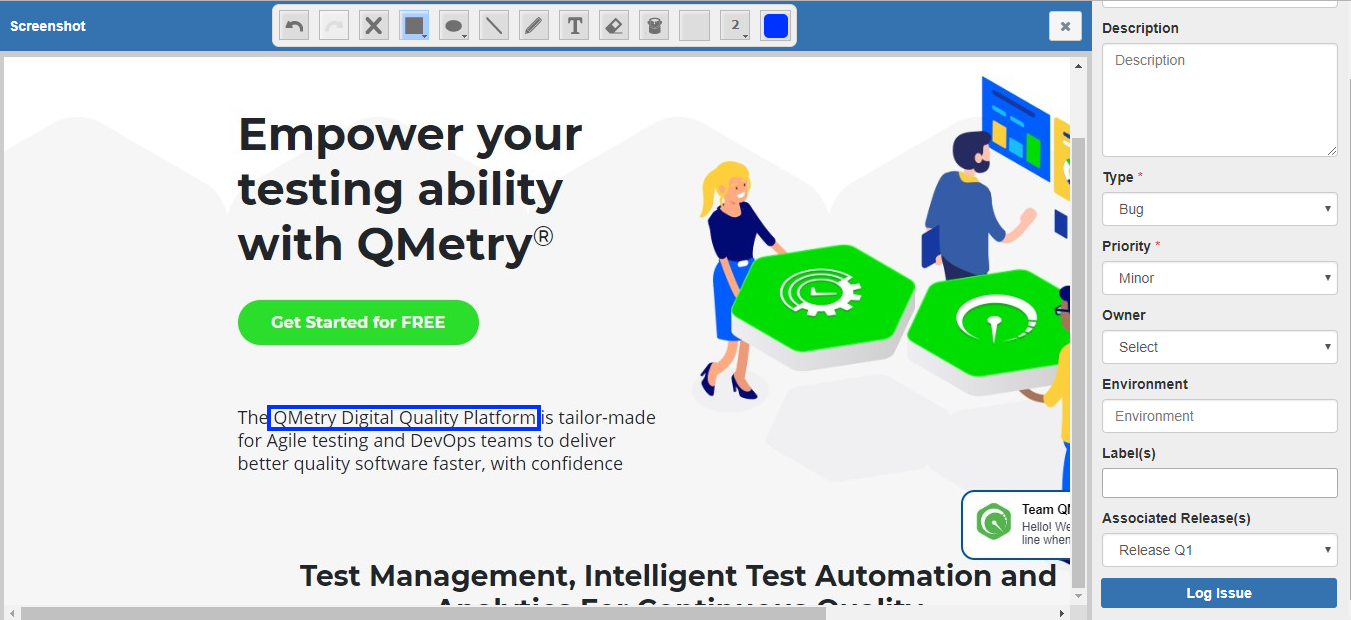
Logging an Issue in QMetry
User can now log the issue with the QMetry field values like following.
- Project: Select the project for which the issue is to be logged.
- Summary: Enter the Summary that represents brief about the issue.
- Priority: Select the priority of the issue from the drop-down list.
- Labels: Select the Labels applicable to the issue. You can select multiple options for the field.
- Issue Type: Select the issue type from Bug, Enhancement, New Feature.
- Owner: Select the assignee who will work on the issue from the drop-down list.
- Description: Describe the issue in detail in this text area.
Logging an Issue in QMetry for Jira - Test Management
If Jira is configured with the project in QMetry, then you can log issue directly in Jira.
First select the Jira instance to which you want to log the issue.
The External Project field values will populate according to the instance selection.
Select the Jira Project you want to log issue to.
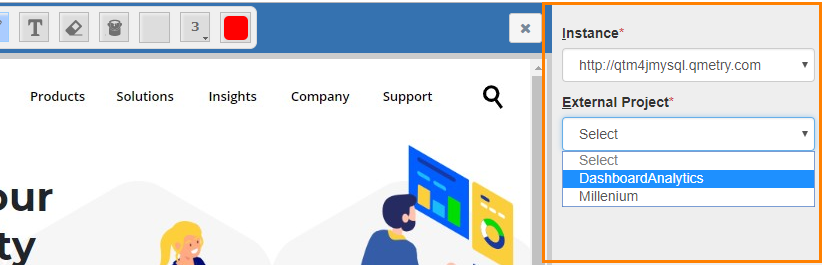
Other fields will appear in accordance with project selection.
View Logged Issues
Issue Logged in QMetry
In QMetry, go to Automation > Exploratory Testing.
You can see the count of issues logged for the tests/sessions.
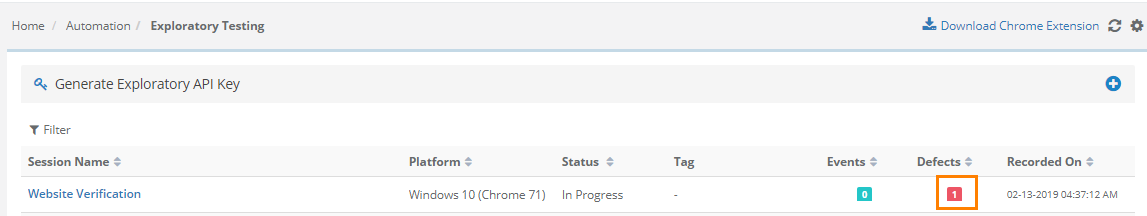
On clicking on the issue count in the grid opens the issue screenshot attached in support of the issue.
You can view the details related to the issue.
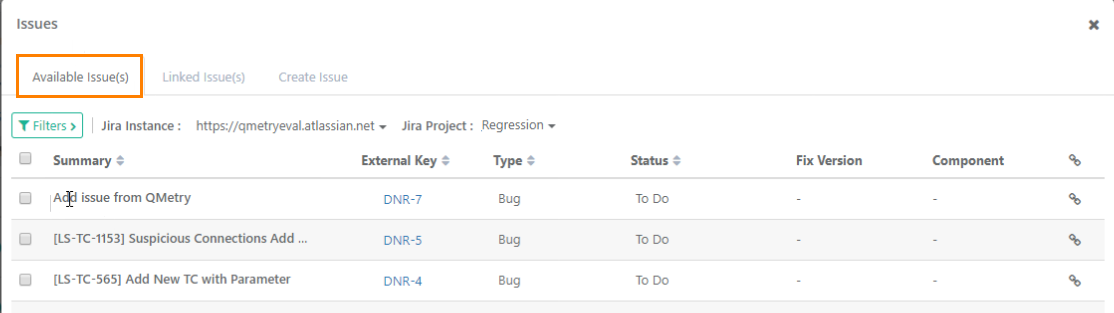
Issue Logged in QMetry for Jira - Test Management
In QMetry, go to the Execution Screen.
Click the Bug icon . It opens the Issues screen.
The issues logged from QMetry Exploratory extension can be seen in the Available Issues tab on the Issues screen.
Log Issues without Sessions
You may come across certain issues that you can not associate with a session instantly. QMetry Exploratory Testing allows you to log issues even without recording a session.
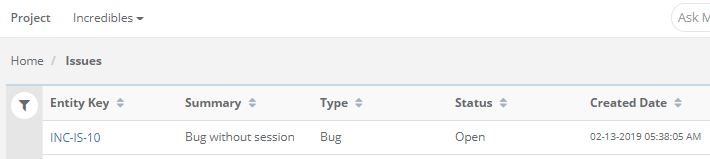
Issues, logged without session, are added to the Issue module in QMetry Test Management.
Steps
Open the QMetry Exploratory Testing add-on.
Click on the Log Issue button at top right corner of the QMetry Exploratory Testing extension main screen.
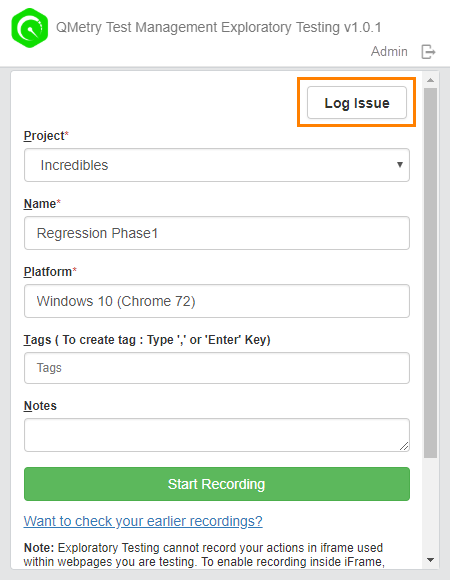
It captures the screenshot of the website screen currently open.
Enter issue details same as you do when logging an issue during recording the session. You can log issues to QMetry as well as QMetry for Jira - Test Management.
If you have added an issue to QMetry, then it is added to the Issue module in the corresponding project.
If you have added an issue to QMetry for Jira, then it is added to the Jira project that has been configured with your QMetry project.
Automated Documentation
After performing testing task through QMetry Exploratory Testing, users can then view the recorded sessions in QMetry Test Management.
Note: You should have the "View" rights for Exploratory Testing for the project to view the sessions recorded by other users of the project.
- Log into QMetry Test Management.
- Go to Automation > Exploratory Testing.
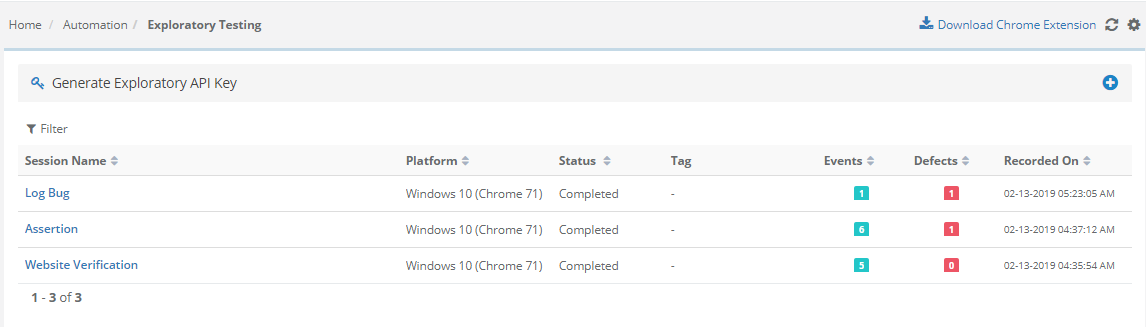
The screen displays a list of recorded sessions. Users can View, Manage and Create Test Cases from the recorded sessions.
The records display Session Name, the Platform on which it has been tested, Status, and the Date and Time it has been Recorded On. The count of Events recorded, Tags, and Defects logged for the session are also displayed on the screen.
Filter Session Records
If it is a long list of recorded sessions, then you can apply filter to get the required session.
The following filters can be applied to search required sessions:
- Session Name
- Platform: Search test scenario by Platform that was mentioned while its creation.
- Status: Search test scenario by its status either "In Progress" or "Completed" or "All"
- Created By
- Recorded Duration: Mention the date range within which the test scenario was created.
Just click on the session you want to view the recordings of.
The next screen shows the following tabs on it:
- Screens
- Document
- Event Detail
- Defects
Edit Session Details
Expand the upper panel by clicking on More Details.
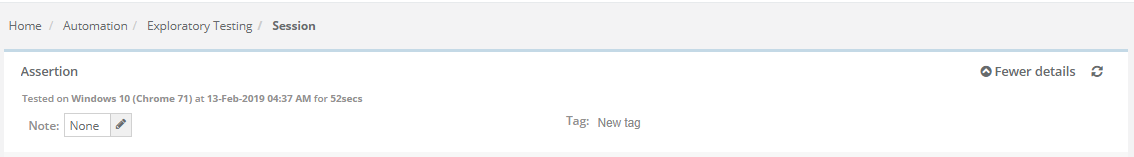
It opens session details fields in editable mode. Hover the mouse over fields and the pencil icon appears for fields which are editable.
Session Name, Note and Tag are editable. Make required changes in the session details.
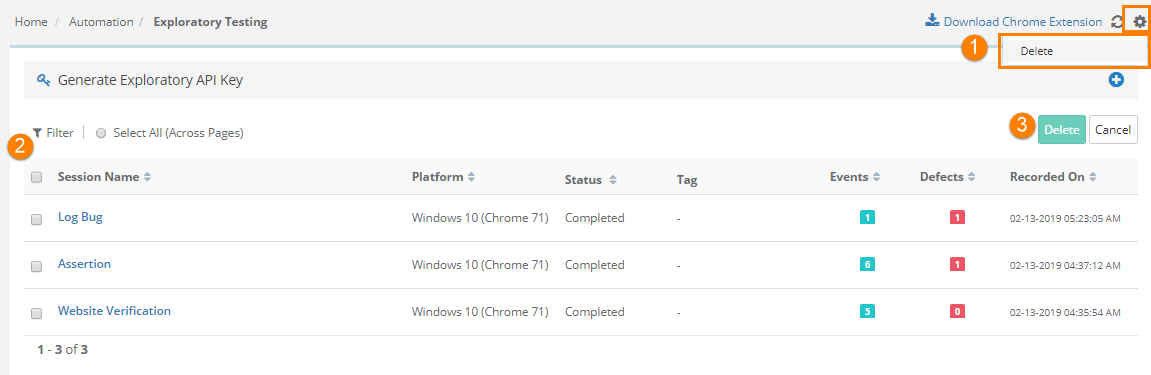
Delete Sessions
Users can delete test sessions that are no more required.
Go to Automation > Exploratory Testing.
- Click on the cog icon at the top right corner and select Delete. It makes check boxes for session records visible.
- From the test records, select the test you want to delete by checking the check box(es).
- Click on the Delete button at top right to delete the session(s) selected on the grid.
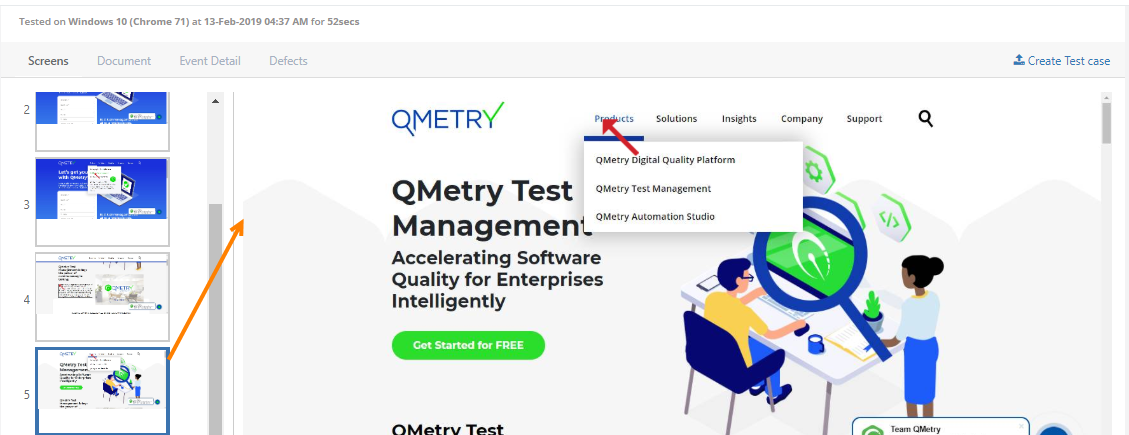
Screenshot View
The Screens tab contains screens captured during testing activity. The thumbnails are displayed on the sidebar at left.
Click on the thumbnail to view the full image at right.
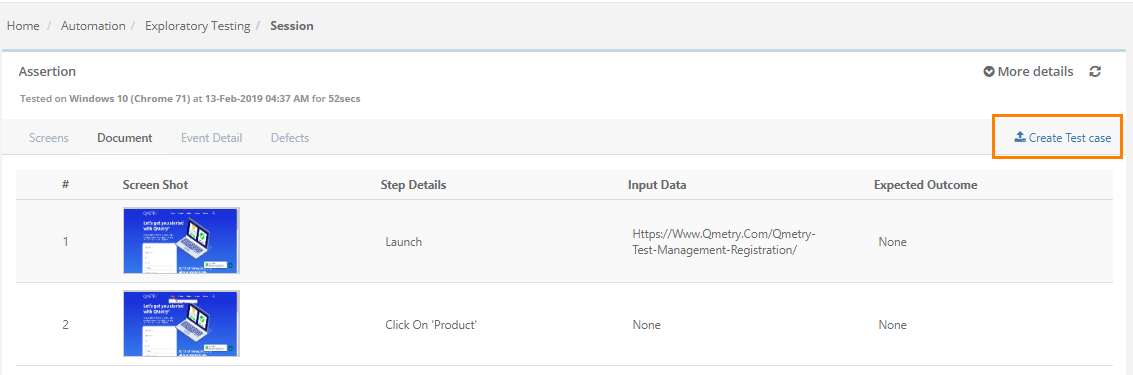
Document
Your each and every event on the website are recorded in the form of test steps.
The Document tab displays Screen Shot thumbnails with its Step Details, Input Data and Expected Output. The recording creates automated documentation that you can read and interpret easily.
Step Details is your action you perform, Input Data is the website you are exploring and Expected Output is an Assertion that you supplied while recording the session.
All the things are captured in the form of text and described as documentation.
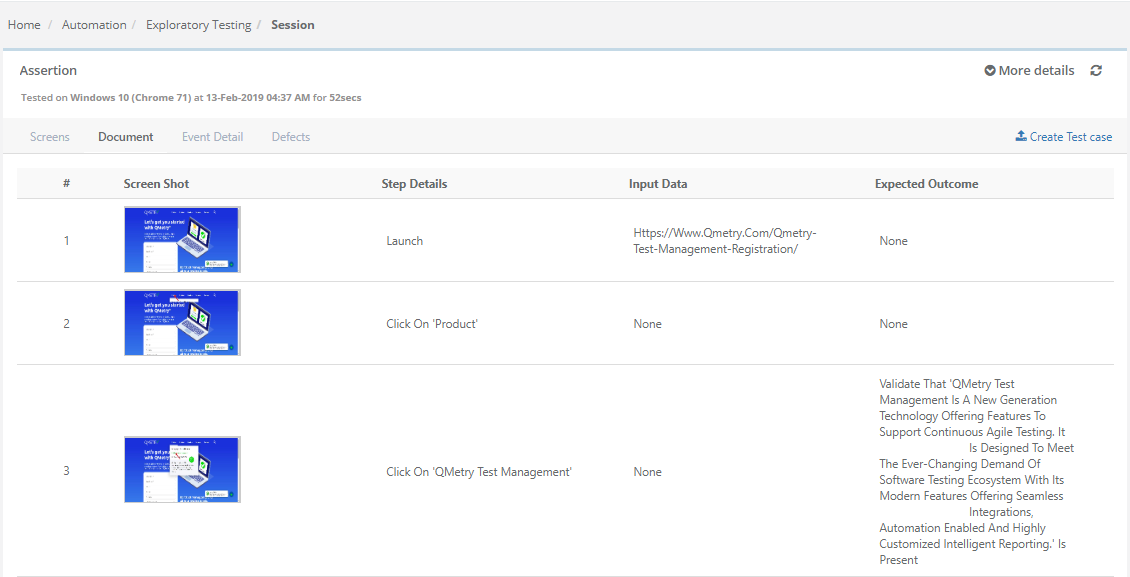
Step Details, Input Data and Expected Output fields are editable. You can modify the field values as per requirement.
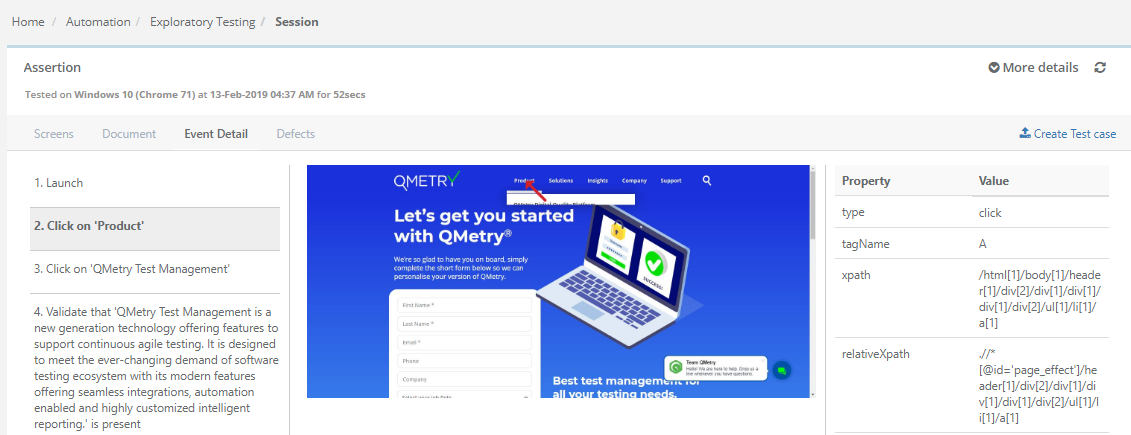
Event Detail
The Event Detail tab displays event details of each event carried out during recording the session.
There are three vertical panels adjacent to each other:
- First panel displays events in sequence.
- Second panel displays image for the even selected in the first panel.
- Third panel displays Property and Value for the event selected in the first panel.
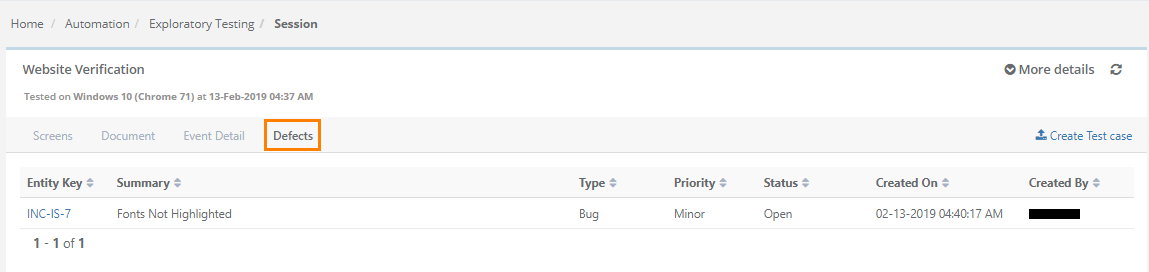
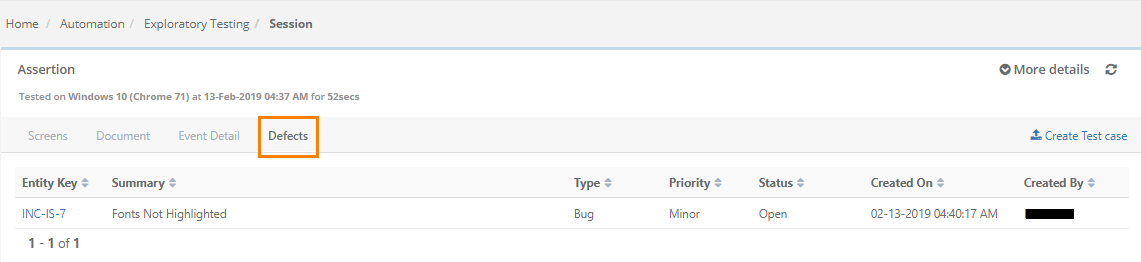
Defects
The Defects tab displays bugs that you logged while recording the session. This bug is logged in the Issue module of QMetry Test Management.
To open the issue detail page, click on the Entity Key that opens the issue in the Issue module.
Create Test Case from Recorded Session
Users can create test cases in QMetry from the sessions recorded during exploratory testing. It saves time as users get automated test cases without writing them manually.
Pre-requisites: User should have Test Case module "Create" rights and Exploratory Testing "View" rights.
Go to Automation > Exploratory Testing.
Open the session you want to create test case from.
You can see the Create Test Case option at top right corner.
It opens Create Test Case screen with QMetry fields on it.
Session Name is populated as Summary.
Events are populated as Test Steps.
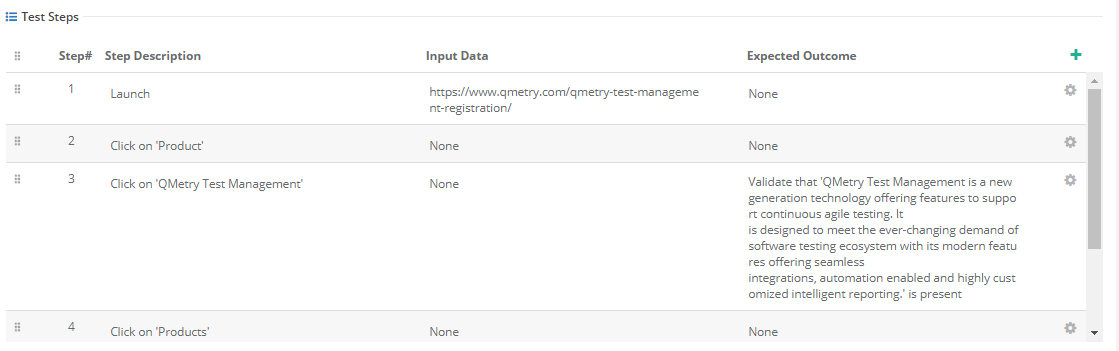
Images captured during the session are available as attachments with corresponding test steps.