Back to QMetry All Products Help Page
Test Distribution Report
The report shows trend of test cases created over time. This report can be further filtered by Time, Sprint, Version, Label, and Component.
Test Distribution Report can be viewed either as a Chart or as a Table.

A. Time Scale
You can generate the report for different time scale:
(a) Time frame
| Time frame | The report is generated on calculation of the data that existed during – |
|---|---|
| Past Week | past week from the current date |
| Past 2 Weeks | past two weeks from the current date |
| Past Month | past month from the current date |
| Past 3 Months | past three months from the current date |
| Past 6 Months | past six months from the current date |
- Custom: Use the calendar to select “From” and “To” dates to define the time to consider the data. The "Custom Dates" is enabled as soon as you select the Custom Time frame.
(b) Custom Dates: Use calendar to select the "From" and "To" dates.
(c) Period: It decides the granularity of the report that you want to generate.
| Period | Displays information for each - |
|---|---|
| Daily | day falling within the mentioned time frame |
| Weekly | week falling within the mentioned time frame |
| Monthly | month falling within the mentioned time frame |
| Yearly | year falling within the mentioned time frame |
B. Refine Report
You can filter the report on the following parameters:
- Sprint
- Version
- Label
- Component
- Platform
C. Viewing Options
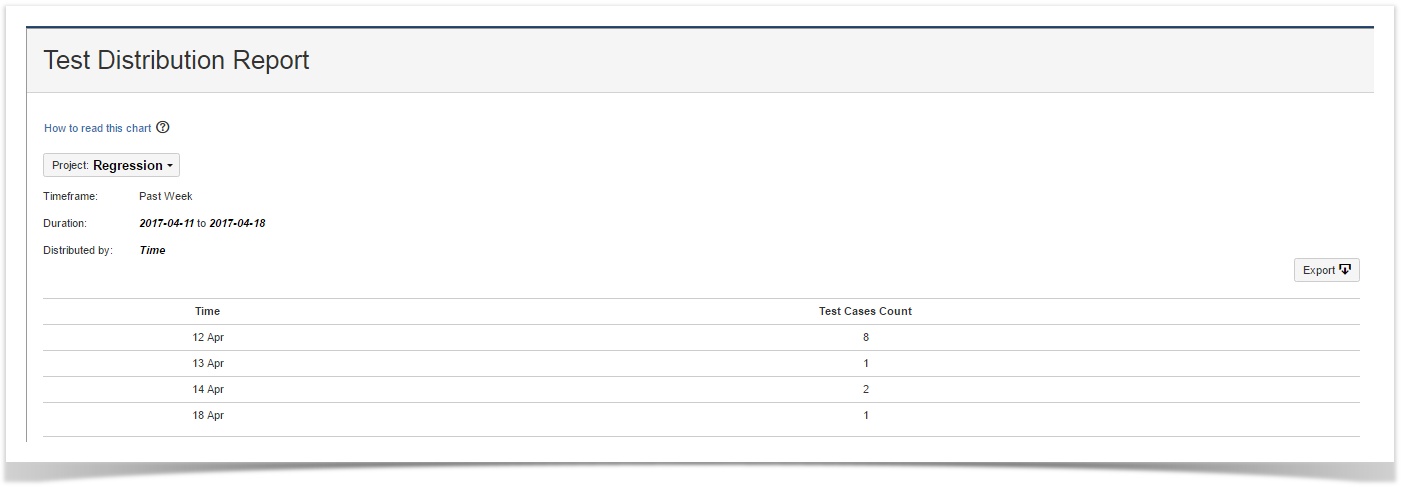
The report shows trend of test cases created over time.
You can view the report as: Chart or Table. Both views can be further filtered by Time, Sprint, Version, Label, and Component.
| Chart View |
|---|
You can view the report in chart format. The chart is clickable. You can drill down to the list of test cases by clicking on the count.

Table View |
|---|
You can view the report in table format.
For the Time/Sprint/Version/Component, the table displays test cases Count.