Back to QMetry All Products Help Page
My Dashboard
About My Dashboard (the default landing page)
This is personalized dashboard for testers. The reports are generated for user/s selected on the User drop-down.
Generate reports and charts for the duration you require or just define custom period to run the report.
Project and User filters are displayed by default.
Jira Assignee and Jira Reporter filters are displayed only when Jira is integrated with QMetry project.
Get statistics on –
- My Test Cases: It shows count of test cases created by the user/s selected on the drop-down.
- Executed Test Cases: It shows count of test cases which are executed by the selected user/s. It excludes test cases with "Not Run" status.
- Pending Test Cases: It shows count of test cases which are assigned to the selected user/s but are yet to be executed and having the Execution Status as "Not Run".
- Issues Found: It shows count of Issues logged by the selected user/s.
My Test Execution
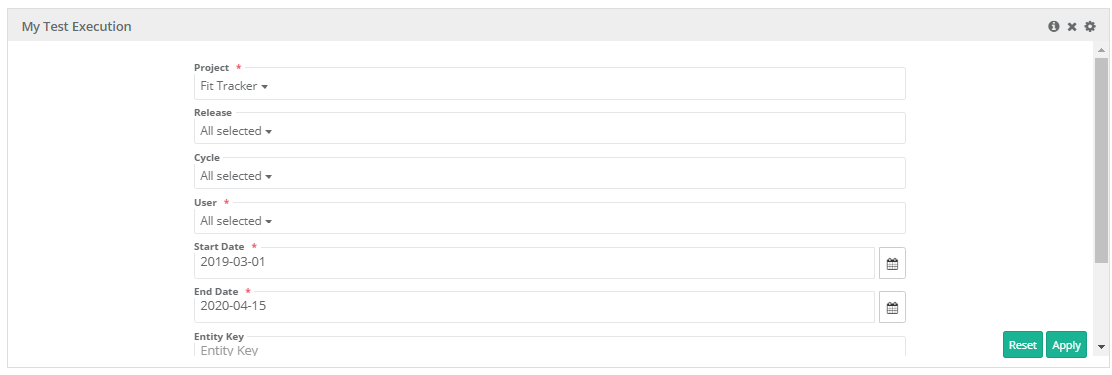
It displays count for test cases assigned to the user/s and which are yet to be executed. These are the test cases the user has to execute or run for testing.
Click on the Filter icon to apply multiple filters.
Uncovered Requirements
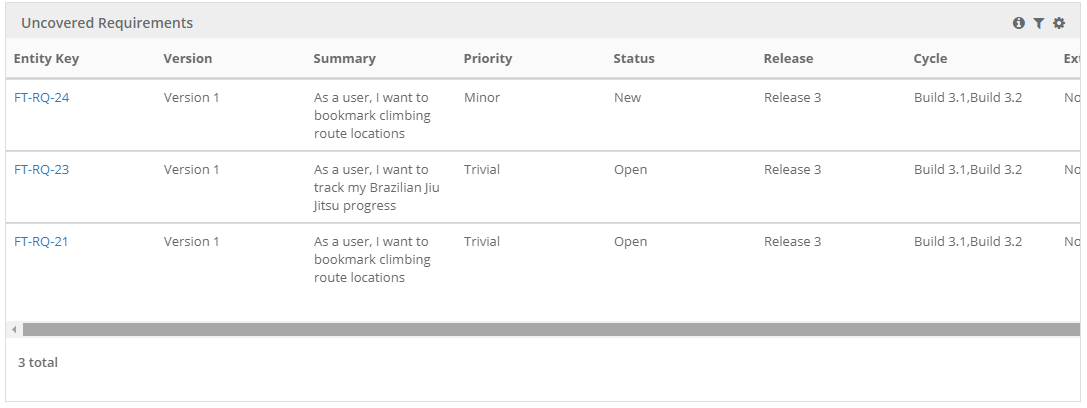
The report displays all requirements which are created by any user but are not linked to any test case yet.
Click on the Filter icon to apply multiple filters.
Test Execution Assignments
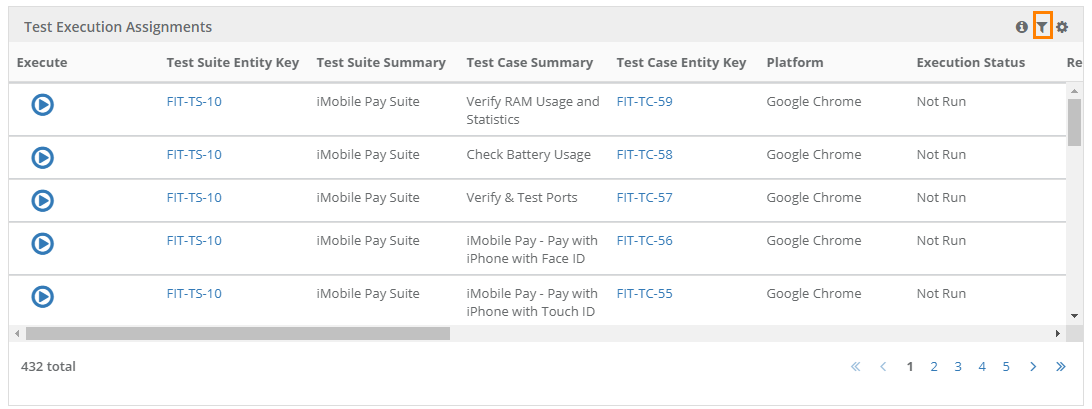
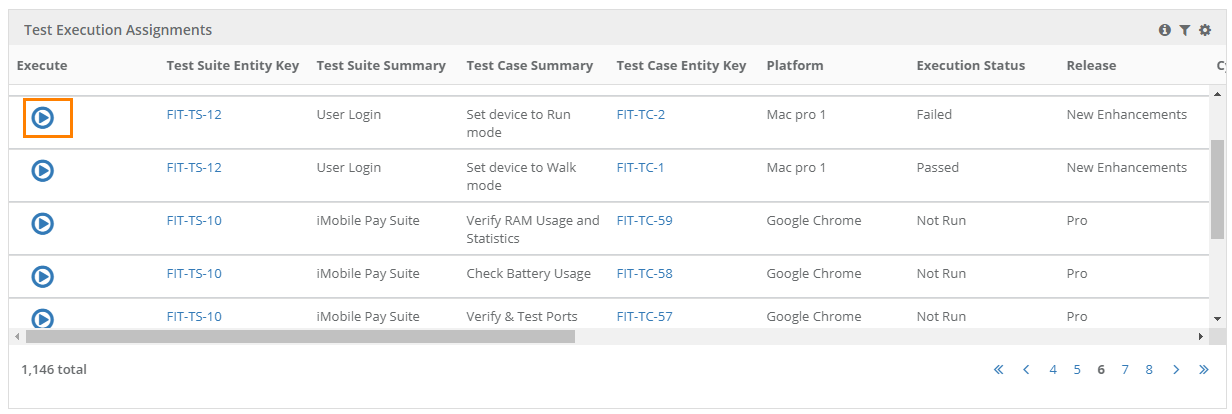
Test Execution Assignments gadget shows a list of test executions assigned to the selected user(s) for a unique combination of test suite, test case, platform, executed version, release and cycle . The Execute button is provided with each test case. Testers will be directly taken to the execution screen by clicking on "Execute" button for the respective test case run.
The gadget shows the following details:
Test Suite Entity Key, Test Suite Summary, Test Case Summary, Test Case Entity Key, Platform, Execution Status, Release, Cycle, Build Name, Test Case Priority, Test Case Status, Assigned User, Executed By, Executed Version, Testing Type, Test Category, Created By.
You can apply Filters on - Project, Release, Cycle, User, Start date, End date, Entity Key, Summary, Platform, Execution Status and Build.
To execute the test case directly from the dashboard, click on the Execute icon for the test case which takes you to the execution screen.
You can change the Execution Status on the execution screen. This execution screen opens up only from this report and is only meant for executing a specific test case.
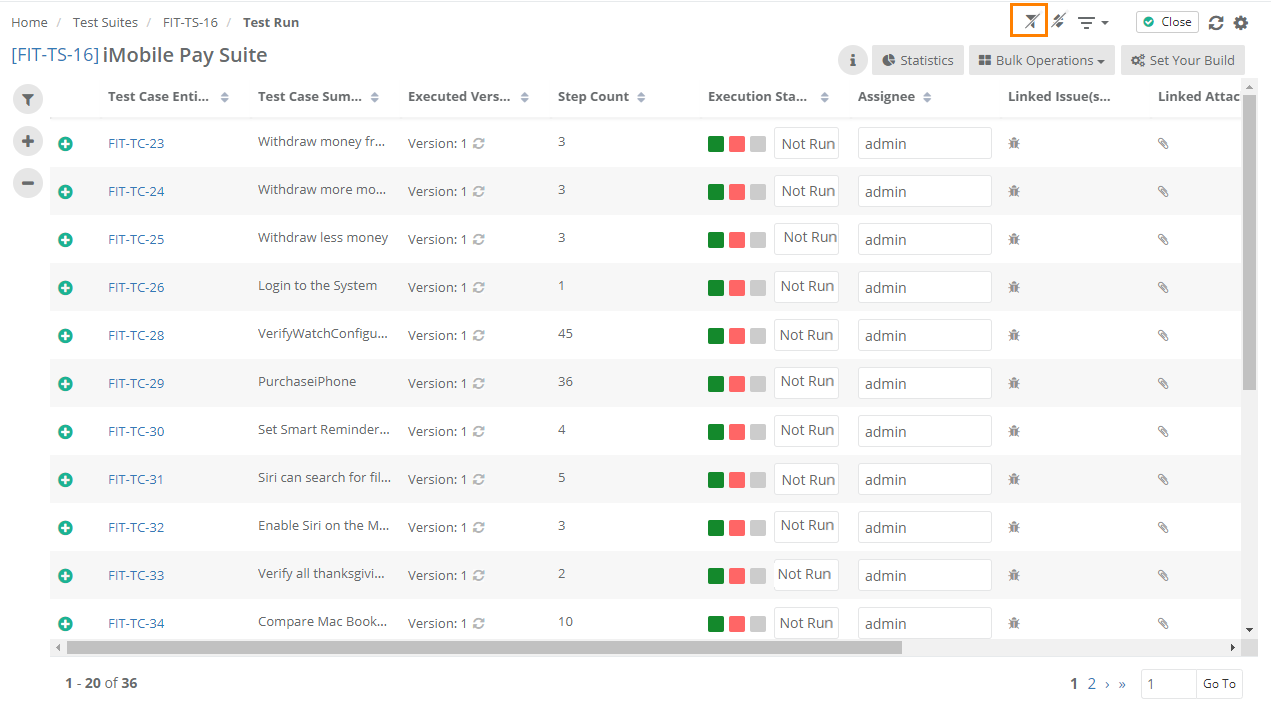
To get back to the regular test execution screen, click on the Test Run.
Then clear the filter on the screen. You can see all the test runs under the test suite.
Export Test Execution Assignments
On the Test Execution Assignments, click on the cog icon and select Export to export the gadget details,
If you need multiple gadgets for Test Execution Assignments, you can add them on QMetry Custom Dashboard by creating a new Dashboard and adding Test Execution Assignments gadgets in it. You can add as many Test Execution Assignments gadgets to apply and preserve them with different filters.
→ Limitation: The filter will not be displayed on hover for My Dashboard as the tables are generated dynamically.
Change Landing Page
My Dashboard is the default landing page when users log into QMetry. Users can also choose to set their preferred landing page from system dashboards, custom dashboards and shared dashboards (i.e. shared by other users).
Steps to set the QMetry landing page
1. Log into QMetry.
2. Go to Profile.
3. Click on the Edit icon to edit the user profile details.
4. Set your preferred Default Dashboard from the available options in the list.
Note: If custom dashboard or shared dashboard is deleted or your access is removed, My Dashboard will be set as the landing page again as default.
Back to QMetry All Products Help Page


.png?version=1&modificationDate=1655361521031&cacheVersion=1&api=v2&width=756&height=250)
