Back to QMetry All Products Help Page
Test Execution Screen Default View
Introduction
Test Suite Execution screen is used for performing Manual Testing and scheduling Automation Testing by QA teams. Test suites are executed on different platforms and the run results derived therefrom are marked on the screen. There are two view available for test execution screen: Default View and Detail View. You can select the view as per your preference. This page refers to the Default View of test execution screen. To read about Detail View of test execution screen, refer to Test Execution Screen Detail View.
Execute Test Suites
Open the test suite detail page and open the Test Execution tab.
Execution Time and Remaining Time
Users can view Execution Time and Remaining Time calculated for Test Execution.
Use Case: Calculation of Execution Time and Remaining Time for test suite is useful for QA Manager in Test Planning as it gives accurate estimates for the test suite. These test case level estimates refine each time a test suite is executed. Testers can make recommendations to have the test estimates revised based on the last few executions in different environments.
Two columns Execution Time and Remaining Time are added on the grid at the following places in the application:
- Test Suite detail page > Test Executions tab
- Test Case detail page > Test Executions tab
- Issue detail page > Execution Runs
Calculation of Execution Time of a test suite:
Execution Time of a test suite is calculated based on Estimate Time of all the test cases in that test suite.
Calculation of Remaining Time of a test suite:
The Remaining Time will be reduced for test cases with “Pass” and “Not Applicable” status only.
The test cases with “Not Run”, "Failed", "Blocked" or "any other custom" execution status will be considered as remaining. QMetry will considered as the work still remains pending for these executions status.
Example
The following example shows calculation of both – Execution Time and Remaining Time.
Execution time | Status | Remaining time | |
|---|---|---|---|
TC1 | 2 | Pass | - |
TC2 | 3 | Not Applicable | - |
TC3 | 4 | Failed | 4 |
TC4 | 5 | Blocked | 5 |
14 | 9 |
Execution Time = 14
Remaining Time = 9
Users can carry out manual testing for individual test suites by clicking on the Execute icon  under the Actions column.
.png?version=1&modificationDate=1680339368661&cacheVersion=1&api=v2&width=1168&height=400)
Test Execution Screen Default View
The Test Run screen displays the list of test cases covered under the test suite.
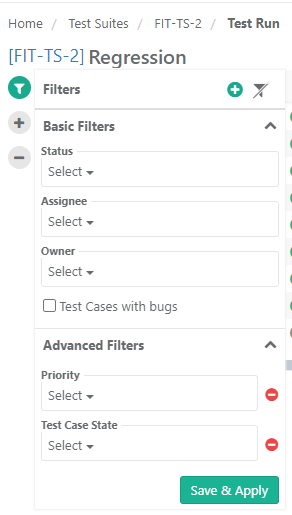
Filter Test Cases on Execution Screen
Users can apply Basic Filters as well as Advanced Filters on the Execution Screen, which allows quick filter of test cases. Users can easily filter test cases by any system/custom fields of test cases.
- Basic Filters: By default, basic filters are provided, which includes system defined fields of test case.
- Advanced Filters: If users need more fields to filter test cases, then click on the '+' icon. It opens the drop-down with a list of additional system and user defined fields for test case. Select the field you want to apply filter on. The filter parameter is added as Advanced Filters. Apply filter as per your requirement.
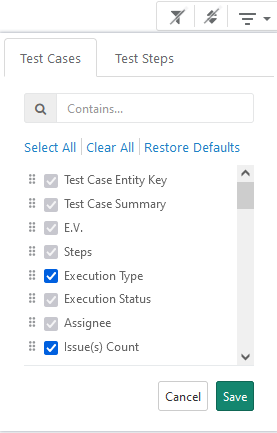
Organize Columns
You can show/hide and organize test case and test step columns on the Execution Screen. Some of the system fields are selected by default. You can also select custom fields (UDFs) to display on the screen. For Test Cases, user-defined fields except Large Text fields can be displayed on the screen. For Test Steps, all types of user-defined fields can be displayed on the screen.
You can also arrange the column display just by dragging and dropping them on the list. The columns for test case and test step will appear as per the column selection you made here.
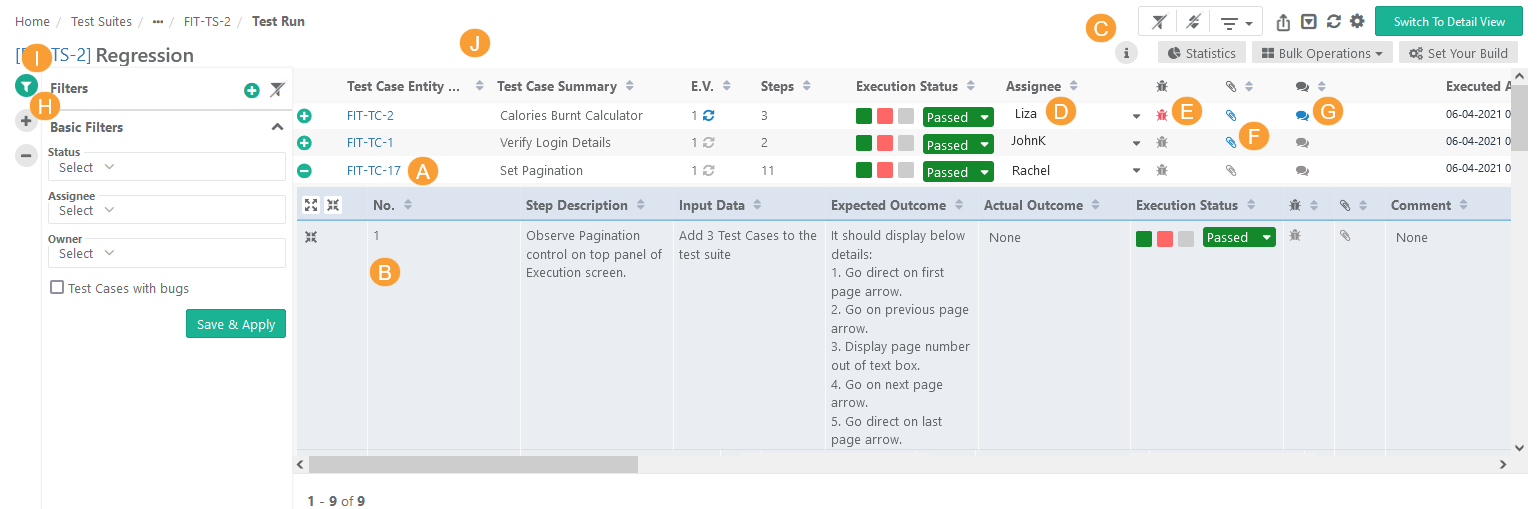
Components of Default Execution Screen
A . The main row on the screen displays test cases
B. Expanded test case to view test steps within it. You can expand/collapse individual steps as well as all steps.
C. Click on the information icon to view details of -
- Platform against which the test is to be run.
- Run Attributes: Run Attributes of the platform. You can also tag Platform Attributes at run time. Read more about Tagging Attributes at Runtime in Managing Platforms.
- Release: Release as selected for the test execution.
- Cycle: Cycle as selected for the test execution.
- Build: The Build on which the test is being executed.
D. Assign tester to the test case: Open the drop-down and select the user to whom the test case is to be assigned.
E. Log issues/defects to the test case. Read more about Adding/Linking Issues to Test Case and Test Step.
F. Add attachments to test case.
G. Add comments to test case.
H. Expand All/Collapse All: Expand all test cases or collapse all test cases on a click.
I. Apply Basic Filters and Advanced Filters.
J. Test execution screen allows testers to resize test case columns to view complete details and saves it in the cache for future usage.
→ Execution Type: The Execution Type column is added to the Test Suite Execution screen so that the testers can mark the executions as Automated or Manual. The column remains hidden by default. Users have to make the column visible from the column list. By default the execution type is "Manual". Users can change the value by opening the drop-down menu and selecting the "Automated" type.
Use Case: Testers need to run particular test cases as Manually and Automated way. Sometimes testers have to manually mark the status of test cases on the Execution screen. Therefore, testers need an ability to mark the executions as Automated or Manual on the execution screen.
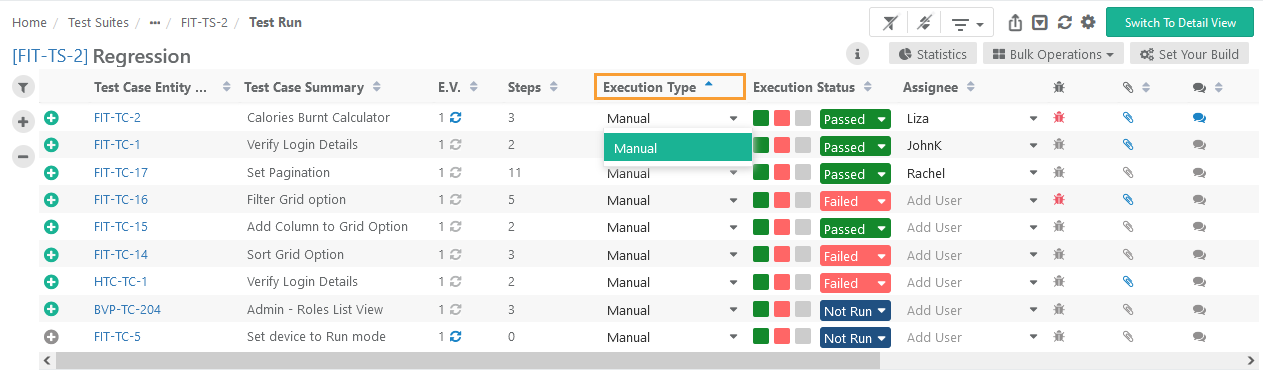
Users can also set Execution Type for bulk test cases at once. Refer to the Bulk Operations section on this page.
Modify Execution Time Stamp
Users can modify test case execution date and time for each test case under the Executed At column.
The following Admin level settings are configured under Administration > General Settings to enable the functionality.
- Go to the Edit Execution Time section.
- Set the Allow manual edit of last executed date/time flag On.
If enabled then only allow edit of last executed date field in Test Execution
The Executed At field is editable only if this flag is turned On.
The Date and Time can be changed at two levels: individual test cases and bulk test cases through Bulk Operation.
Setup vs. Attended Time
Users can enter Actual Setup Time and Actual Attended Time for each test case on the execution screen.
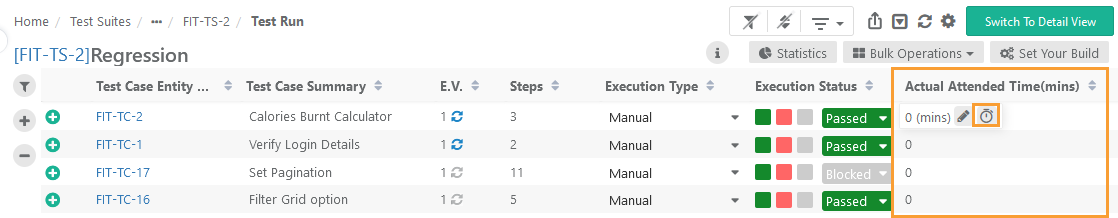
Actual Attended Time (mins):
There are two ways you can input time details in the column:
(A) Enter the time manually by clicking on the cell.
(B) Activate the stopwatch timer to calculate the time and get it auto-entered for the test execution. The time is captured by the timer. You can edit the time manually at any time.
The stopwatch is displayed for every test case execution run when you hover over the cell under the Actual Attended Time (mins) column on the execution screen.
Use Case: Testers want to focus on test execution without bothering about recording the time manually. Hence, they need a stopwatch timer that auto-calculates the time they spent executing the test case.
Notes:
Time will not get saved if it is less than 1 minute.
The stopwatch calculates the time in Hours:Minutes:Seconds and saves the time in completed minutes.
The stopwatch timer is user-specific. The stopwatch functions distinctively for individual users even when they are executing their respective test cases under a single test suite.
Stopwatch Status Icons
Icon | Description |
|---|---|
| Start Timer: The stopwatch timer initiates and begins recording time. |
| Pause: Once the stopwatch timer is started, the tester can pause the timer temporarily and can resume again. |
| Resume: Once the stopwatch time is paused, the tester can resume the timer. |
| Reset: It will reset the stopwatch timer back to 00:00. |
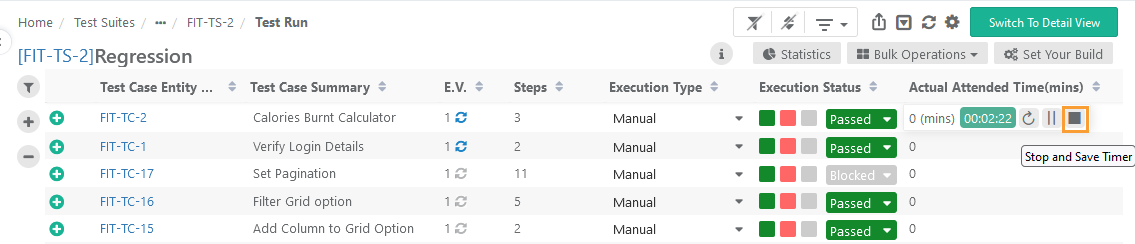
| Stop and Save Timer: Tester will click this option to Stop the timer. Clicking on it should save the calculated time in the field Actual Attended Time as Minutes. This will only appear when the SW is in Start or Paused state. Clicking on it should save the time calculated by the SW. |
| Edit Timer: It allows you to edit the test execution time manually. |


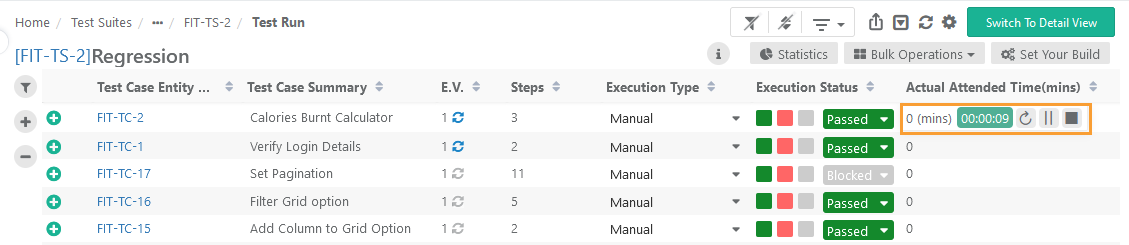
Start Timer
Stopwatch timer started
Stop Timer
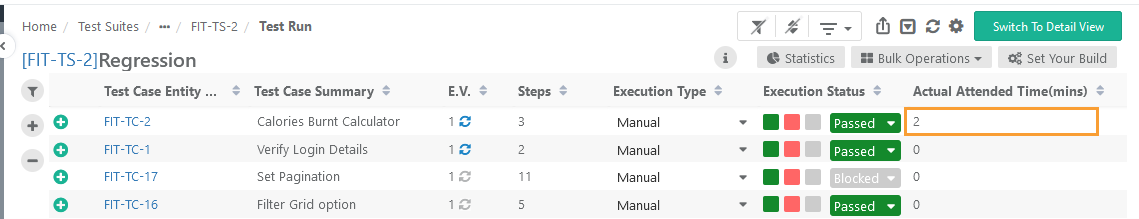
Actual Attended Time recorded through the stopwatch timer
When the stopwatch timer will auto-stop?
When the user changes the status of all the steps in the test case and changes the status of the last step, the stopwatch stops automatically and saves the recorded time.
When the stopwatch timer is started and the user navigates to another test case or moves to some other screen in QMetry, the stopwatch stops automatically and saves the recorded time.
If the stopwatch timer is started and the user logs out or closes the tab while executing, then the stopwatch stops. The time does not get recorded.
If the stopwatch timer is started and the user directly changes the test case execution status, then the stopwatch stops.
Configuration of the Derive Test Case Execution status from Test Case step status option in the Project Settings:
(A) If the Derive Test Case Execution status from Test Case step status option is disabled in the Project Setting: When a test step status is marked as “Failed” or “Blocked”, the stopwatch timer does not stop.
(B) If the Derive Test Case Execution status from Test Case step status option is enabled in the Project Setting:
→ Default Scenarios: During execution when a test step status is marked as “Failed” or “Blocked”, the test case status also changes to “Failed” or “Blocked”. In this case, the timer automatically stops.
→ Custom Configuration of Execution Status for stopwatch timer:
Note: This feature is only available if you have purchased the Customization App of QMetry Test Management.
Prerequisite: The Derive Test Case Execution status from Test Case step status option in Project Settings should be enabled.
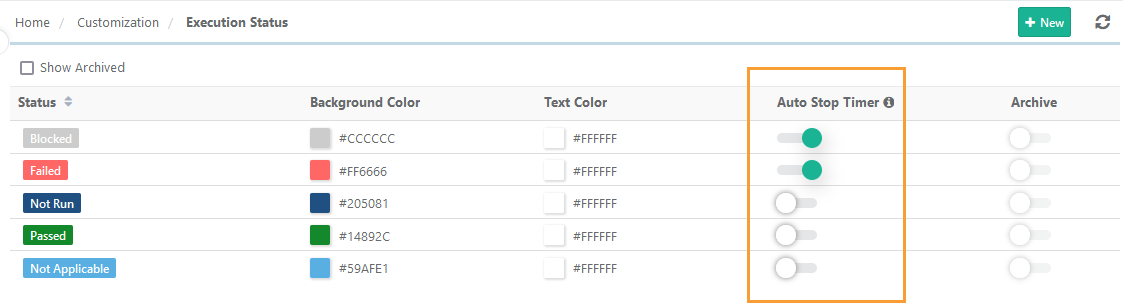
Auto Stop Timer: The option is provided to enable/disable the auto-stop timer when the execution status of the test case step is set as particular execution status. By default, the “Failed” and “Blocked” statuses are selected. It means whenever the test step status is assigned the status of Failed/Blocked, the test case status will also change to Failed/Blocked. Once the test case status is assigned, the timer will auto-stop. You can enable/disable the option for required execution statuses.
→ Required Permission: Project Admin/ users who have Customization “Modify” permission can edit this project-level Execution Status setting.
Attachments
Users can add attachments to individual test cases as well as test steps. Refer to Managing Attachments for more details.
Test Case Attachments
Attachment Level: The column indicates the level at which the attachments are added.
Test Case: The attachments are added from the Test Case module. Attachments added at the Test Case level can be downloaded. You can not delete the attachments added from the Test Case module.
Execution: The attachments are added from the Execution screen. Attachments added at the Execution level can be downloaded and deleted.
Test Step Attachments
Attachment Level: The column indicates the level at which the attachments are added.
Test Case: The attachments are added from the Test Case module. Attachments added at the Test Case level can be downloaded. You can not delete the attachments added from the Test Case module.
Execution: The attachments are added from the Execution screen. Attachments added at the Execution level can be downloaded and deleted.
Comments
On the test execution screen, you can add multiple comments for each test case with the purpose of efficiently collaborating on the testing and keeping track of the conversation.
Steps:
1. Open the test execution screen.
2. Click on the Comment icon for the test case.

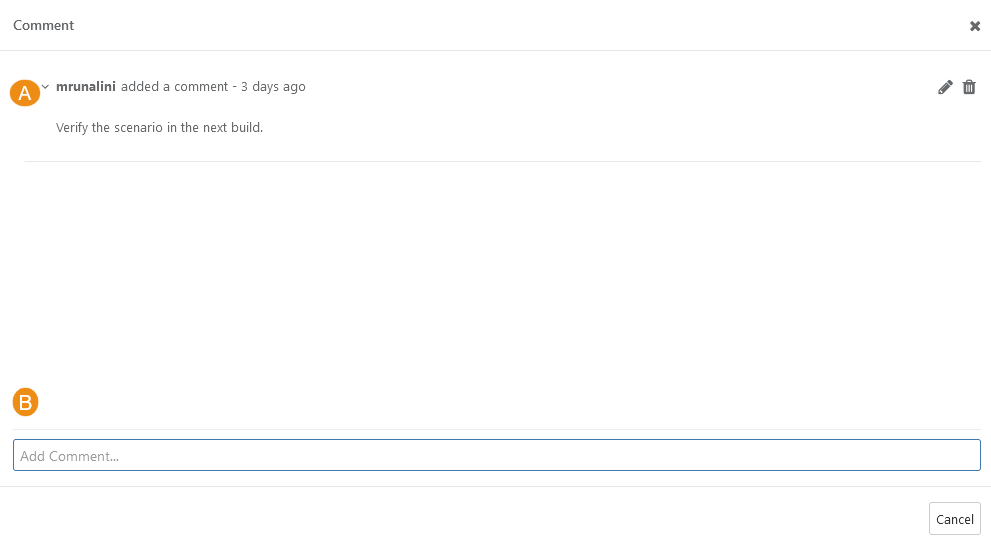
The Comment pop-up opens. You can add multiple comments on the screen.
A. An existing comment
B. Add a new comment
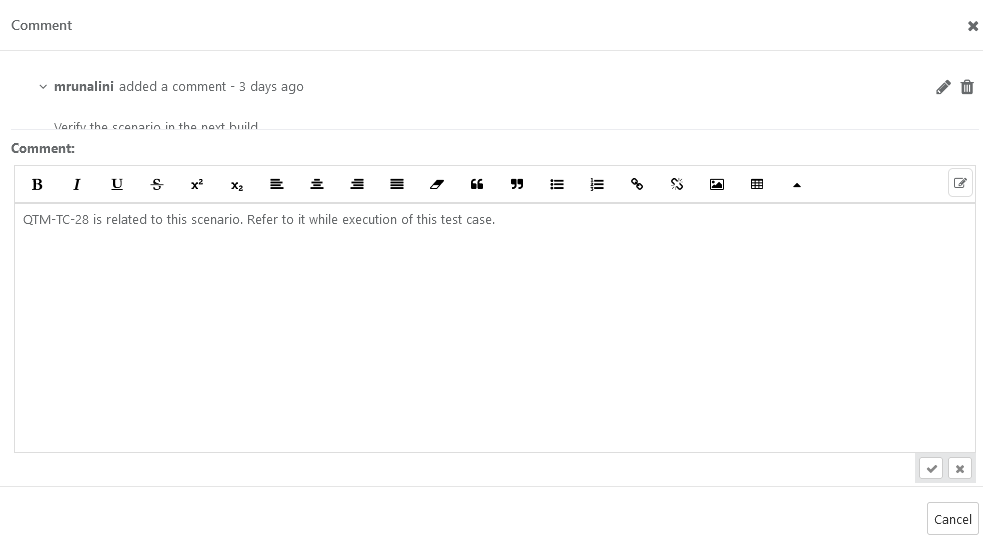
To add a new comment, the wide text area opens.
3. Save the comment after adding.
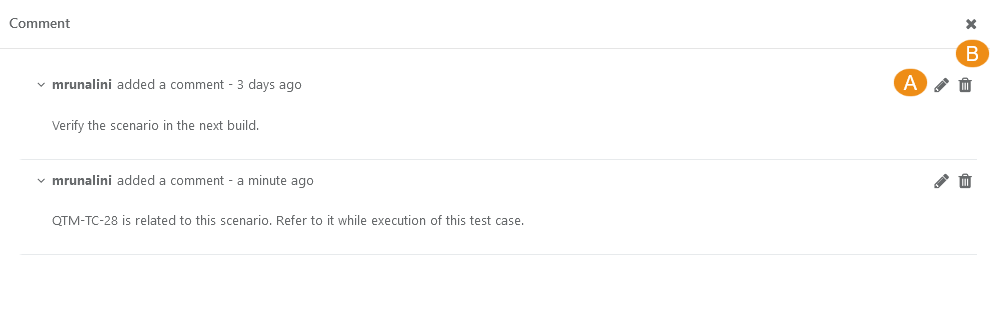
You can edit and delete an existing comment.
A. Edit a Comment: Click on the Edit icon for the comment to edit the content of it.
B. Delete a Comment: Click on the Delete icon for the comment to delete the comment.
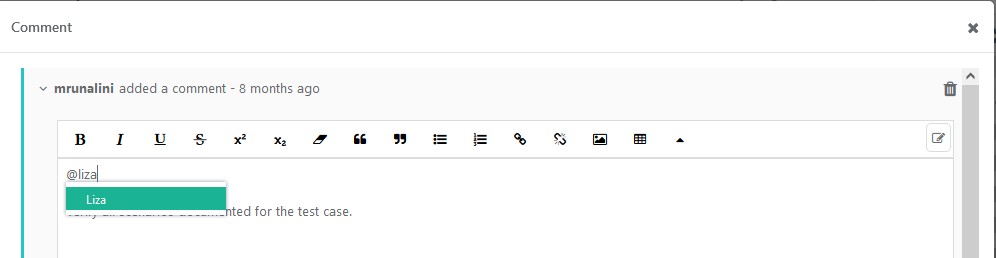
Tagging Users in a Comment
You can tag QMetry users in the Comments section, which improves collaboration among the team. An email notification will be triggered to the user who is tagged on adding/updating the comment.
QMetry users can be tagged by their usernames in the Comments section. For example, @<username>
Execute Individual Test Cases
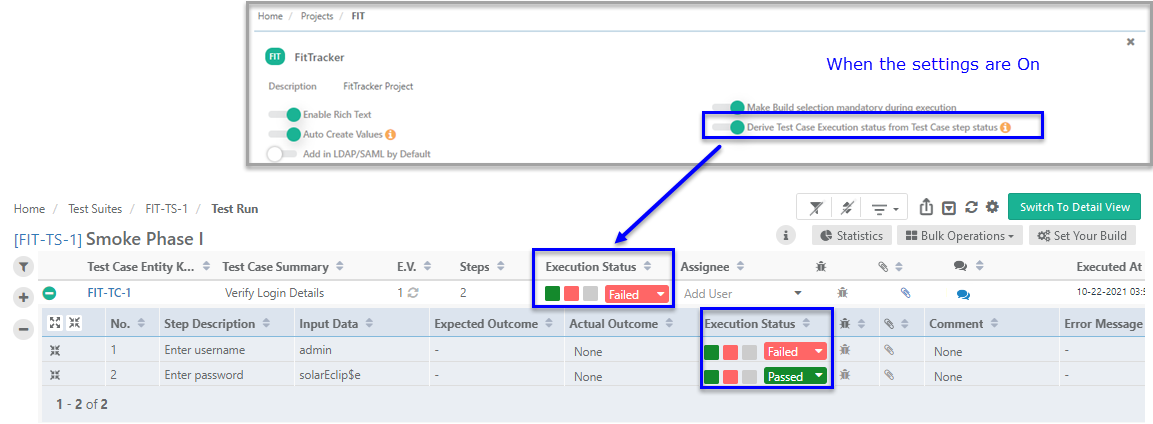
The test case execution status derives from test case step status and vice-a-versa. Assign Execution Status to individual test steps/test cases.
The derivation of Execution Status of test case and test step depends on the Derive Test Case Execution status from Test Case step status settings done in the Project module. The settings remain “On” by default, which derives test case execution status from test case step status and vice versa.
An option is provided to disable auto-deriving test case execution status from step statuses and vice-versa is provided under Project Settings. Refer to Managing Projects, Releases and Cycles for more details.
When the Derive Test Case Execution Status from Test Case Step Status settings are turned “On” in the Projects module: The test case execution status derives from test case step status and vice-a-versa as per the set priority of Execution Status as described in Execution Status Management.
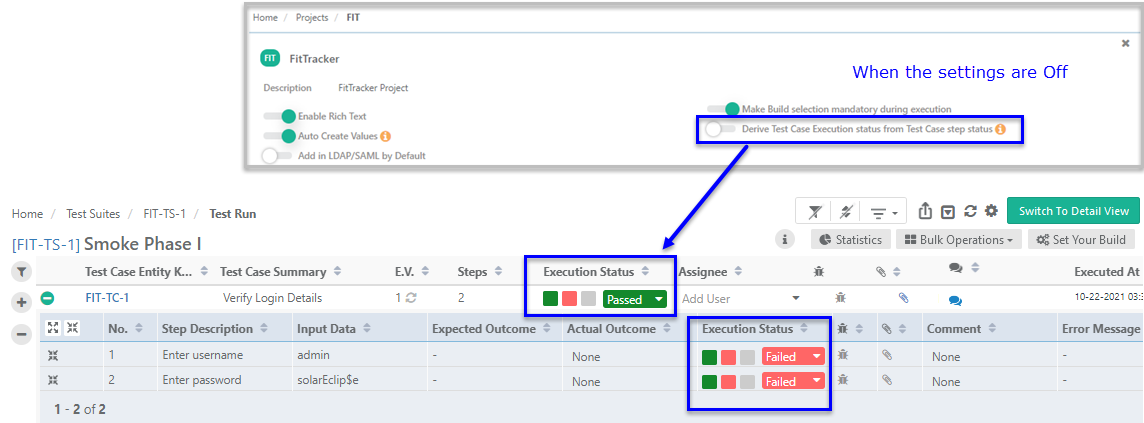
- When the Derive Test Case Execution Status from Test Case Step Status settings are turned “Off” in the Projects module: When the flag is turned Off, users need to manually change the status of the test case as it will not get changed as per the status assigned to test steps underneath.
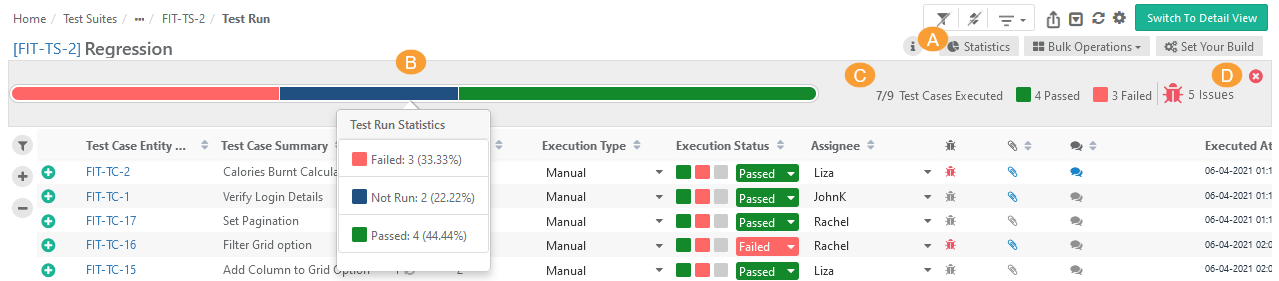
View Statistics of Execution
The Statistics button is provided at the top of the screen.
A. Click on the Statistics button.
B. It displays a status bar regarding execution status of test cases. The status bar is generated based on the status of each test case execution (i.e. Not Run/Passed/Failed/Blocked/Not Applicable/any other user defined status) of each individual test case.
C. It displays the statistics for executed test cases.
D. To close the statistics pane, click on the Close Statistics button.
Bulk Operations
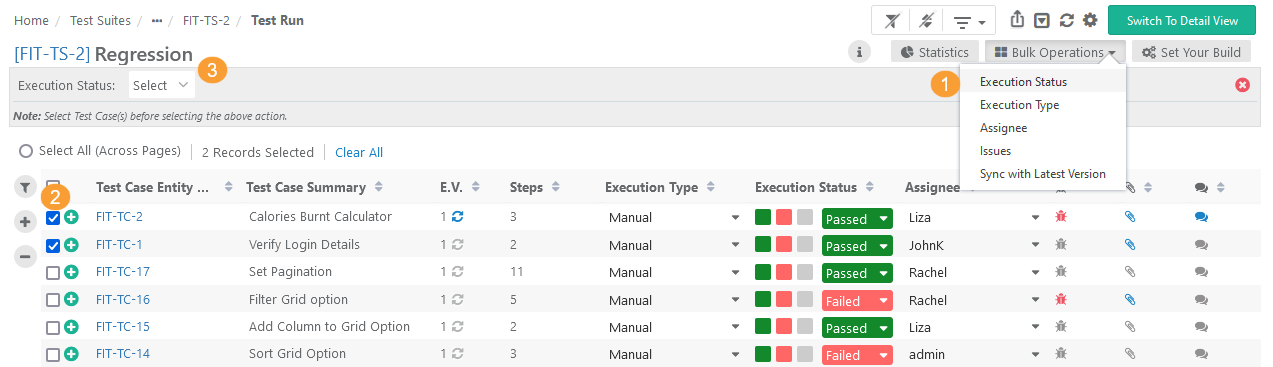
Execution Status
You can also assign execution status to multiple test cases at a time.
Use Case: A new build is received from the development team and the QA Manager has scheduled Regression Test. The scope covers multiple modules and functionalities thereof. Testers are well aware of the test cases and test steps associated with each module. So they jump start on executing the test cases one after another without going into details. They keep running continuous execution without updating the run status of each test case. At the end or at a certain point they just update the status of bulk test cases with a few clicks instead of assigning status one by one on each test case execution.
1. Open the Bulk Operations drop-down and select the Execution Status option on it. It makes the Status drop-down visible which has Passed, Failed, Not Run, Blocked and Not Applicable statuses on it.
2. Select multiple test cases to which you want to apply the status.
3. Select required status on the Execution Status drop-down. It applies to all the test cases selected on the grid.
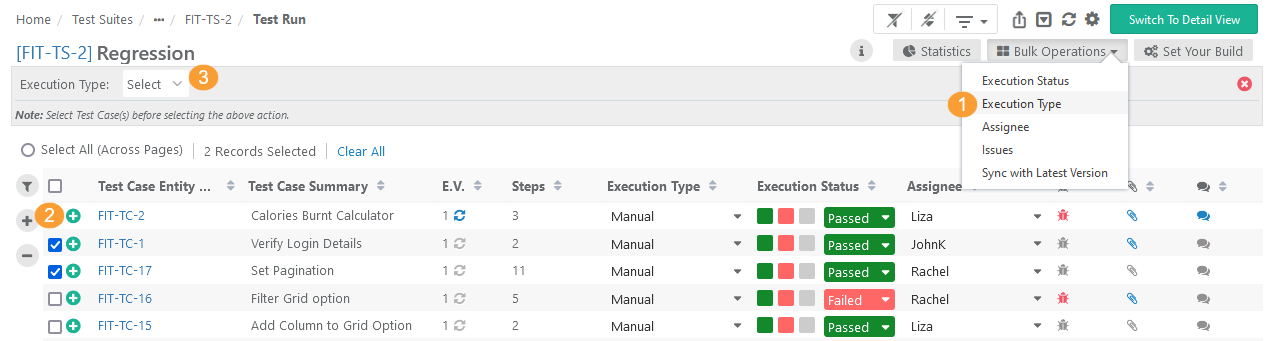
Execution Type
Users can assign Execution Type in bulk to test cases whose execution type is similar. Users do not have to update the Execution Type of test cases one by one.
1. Open the Bulk Operations drop-down and select the Execution Type option on it. It makes the Execution Type drop-down visible which has the list of users on it.
2. Select test cases on the grid.
3. Open the Execution Type drop-down and select the type that is to be assigned to the selected test cases.
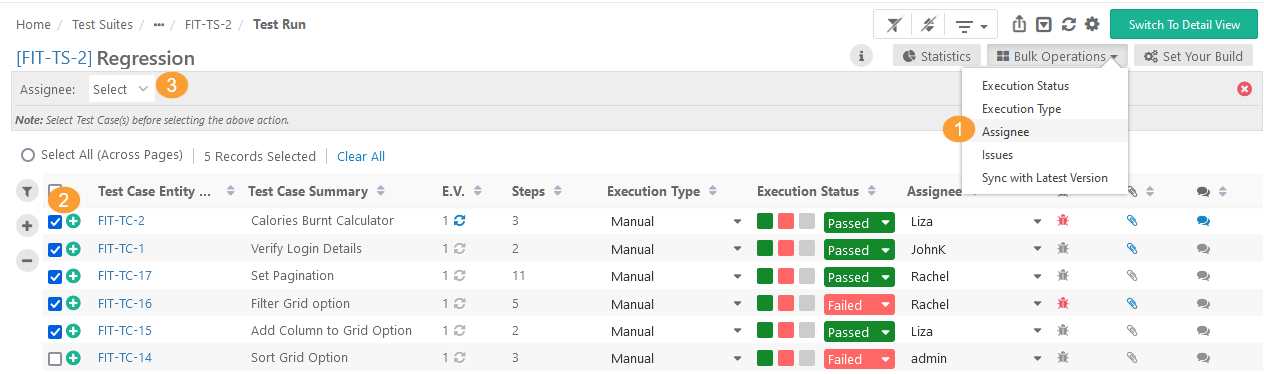
Assignee
Users can assign test cases in bulk to a tester to execute. It saves QA Lead/Manager's time to assign multiple test cases to the same tester.
1. Open the Bulk Operations drop-down and select the Assignee option on it. It makes the Assignee drop-down visible which has the list of users on it.
2. Select test cases on the grid.
3. Open the Assignee drop-down and select the tester to whom all the selected test cases are to be assigned for execution.
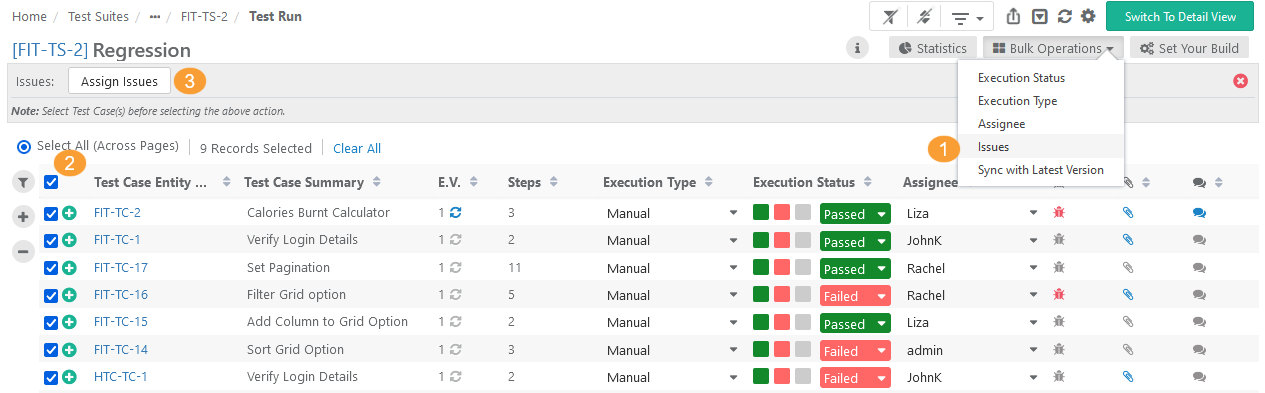
Issues
Users can link QMetry issues or Jira defects to multiple test cases at a time.
User Case: A testing team has some test suites containing many test cases. They want to link a Jira issue with multiple test cases. Linking an issue to each execution can be very time consuming. Thus, they want the ability to link a JIRA issue to multiple executions at once.
1. Open the Bulk Operations drop-down and select the Link Issues option on it. It makes the Assign Issues button visible.
2. Select test cases on the grid.
3. Click on the Assign Issues button. It opens Issues screen.
Then follow the same mentioned process of linking existing issues. Read more about Adding/Linking Issues to Test Case and Test Step.
When opening the issue in Jira, the test case links in Jira are displayed in accordance with the defects linked with test cases in QMetry.
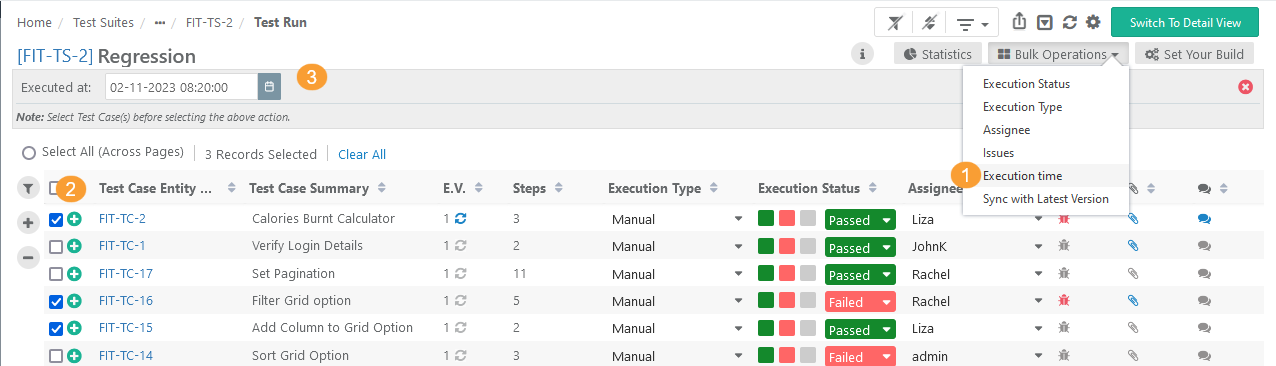
Execution Time
Users can modify the execution date and time for multiple test cases at a time.
To enable the editing of the Execution date and time, go to Customization > General Settings & Audit and turn the Allow manual edit of last executed date/time flag On.
1. Open the Bulk Operations drop-down and select the Execution Time option on it. It makes the Execution At field visible.
2. Select test cases on the grid.
3. Select date and time of execution using calendar and click Apply.
The date and time is changed under the Executed At column for the selected test cases.
Assign Build for Test Executions
QMetry defines a Build as a specific iteration of the product/domain to be tested. The feature allows the tester to assign a "build" (aka patch, drop, or increment) to test suites that indicate the version of the product being tested. It helps to track multiple builds of software more dynamically without having to add separate test suites with every new build.
Refer to Assign Build for Test Executions for more details.
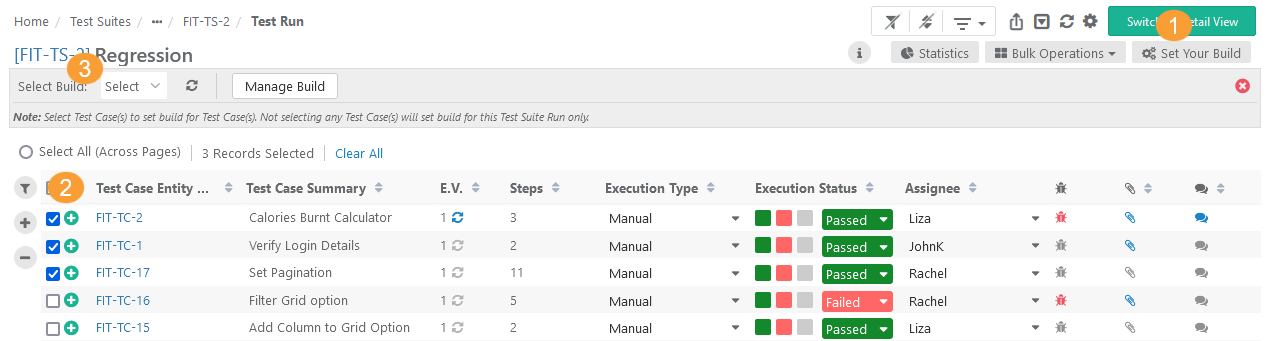
Create New Build
Users can create builds from the Execution screen.
Click on the Set Your Build button, select the test cases to which you want to apply the build and select the build from the drop-down.
Manage Build: Clicking on the Manage Build button opens Builds section (Projects > Builds) in another tab. Refer to Managing Builds to know more about adding a new build.
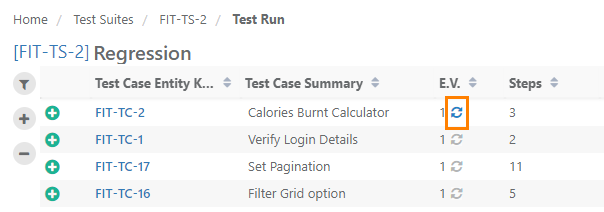
Link Latest Test Case Version at Run-time
Users can associate latest version of the test case to the test suite from the Execution screen by syncing test case version.
In case the test case updated with a new version, which is not associated with the execution, then the Version will show the Refresh icon in blue color.
Sync a Single Test Case to Latest Version
Clicking on the Refresh icon, the test case version will be updated to the latest one. Any changes related to test case parameters and test steps will be updated. The execution status of the updated test case will be reset to Not Run.
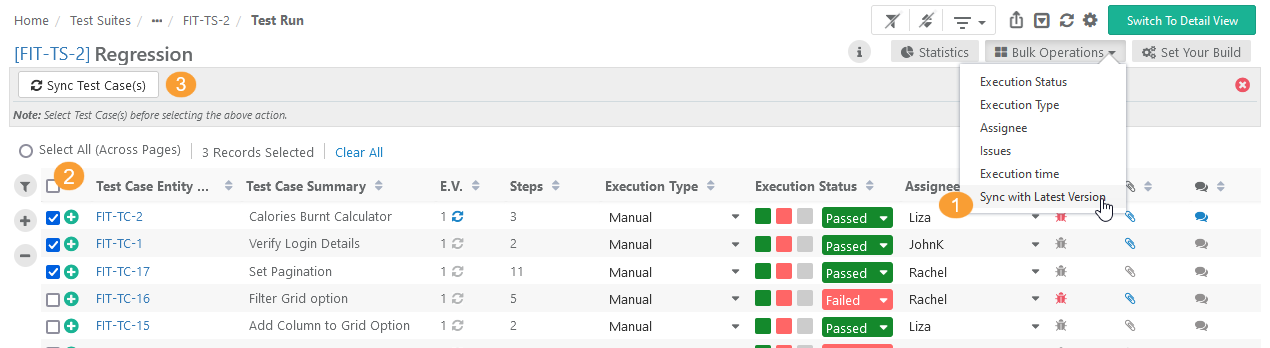
Bulk Sync Test Cases to Latest Version
You can sync multiple test cases to their latest version at once.
- On the Test Execution Screen, open the Bulk Operations drop-down menu and select Sync with Latest Version.
- First select the test cases that you want to sync with their latest version.
- Then click on the Sync Test Cases button.
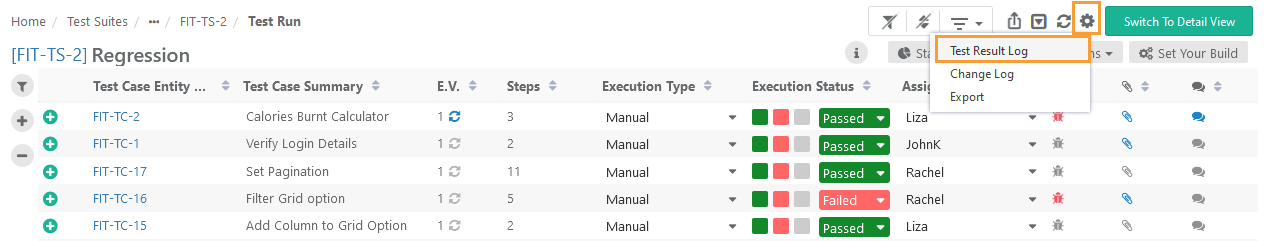
Test Result Log
The Test Result Log displays detailed information about each test. As each test completes, the status column updates with the test execution result. It generates a full-detailed log of all actions it performs during the test run. The test log provides the test run summary, indicates the results, and contains detailed information for each test operation.
Open the Test Suite Execution screen.
Click on the Settings icon at top right corner and click on the Test Result Log option.
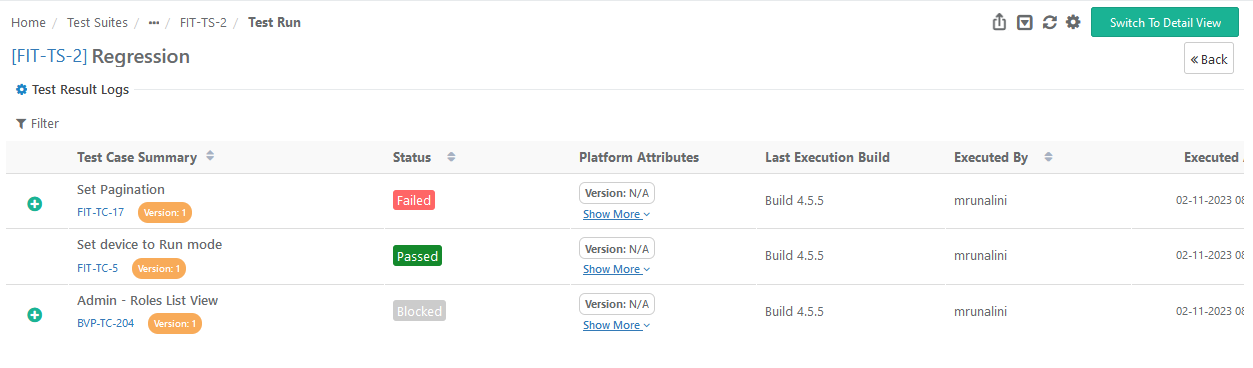
The test log contains all relevant information about the test run, such as Test Case Summary, Test Case Version, Test Case Step, Status, Executed By, and Executed Date and time and so on.
You can apply filter view required logs.
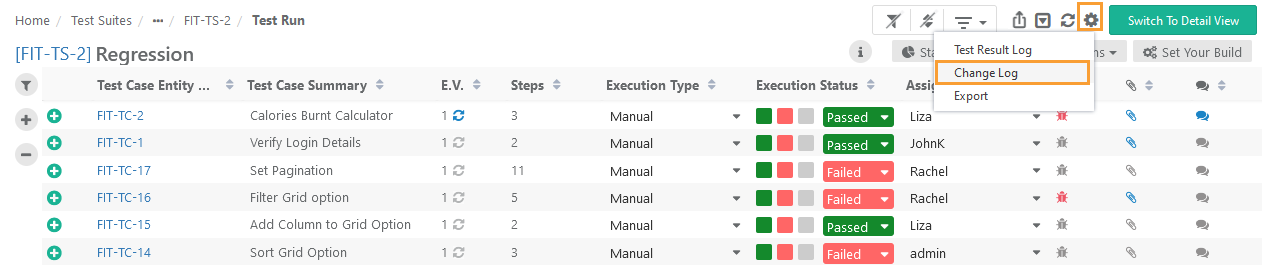
Change Log
Open the Test Suite Execution screen.
Click on the Settings icon at top right corner and click on the Change Log option.
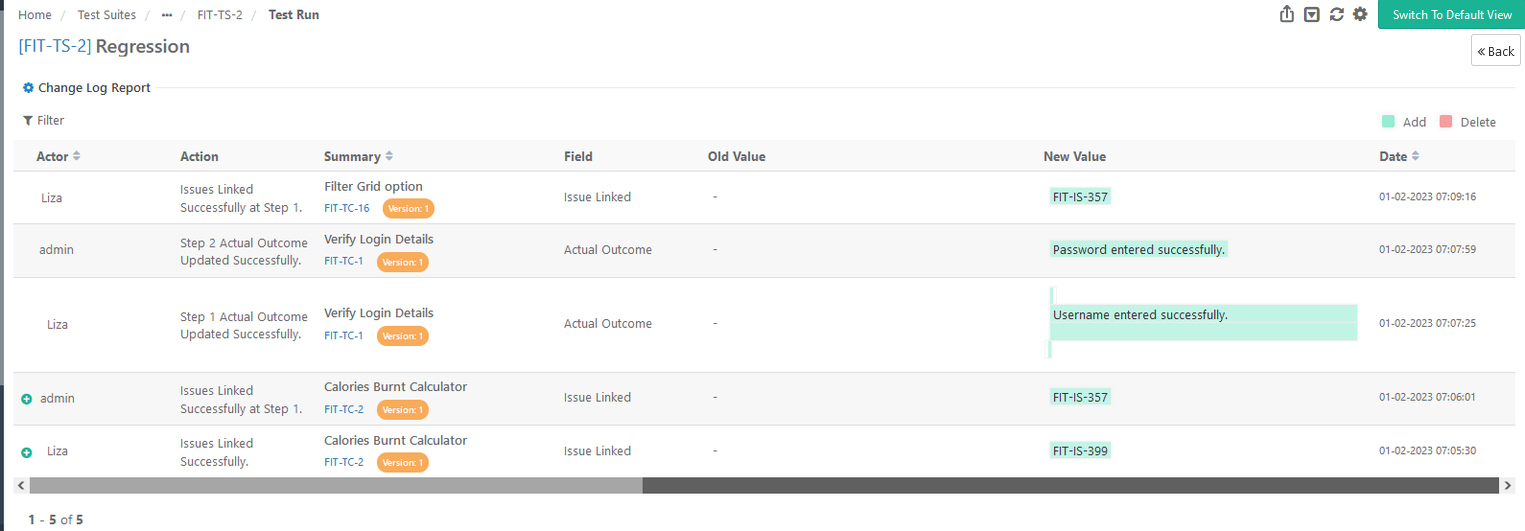
The Change log displays logs of the following activities carried out on the execution screen for a particular Test Execution.
- Assign Tester
- Add/Edit Comment
- Set Build
- Change Execution At (time)
- From Bulk Operation: Assign Tester, Change Execution At (time)
Change Log helps you to track the changes done at the execution level.
The details include Actor, Action, Test Case Summary, Field, New Value, Old Value, New Value and Date. You have the option to filter the records.
If any changes are done at test step level, then the step details are also displayed in the Action column. It helps users to identify which test step was modified and track the activities in the steps.
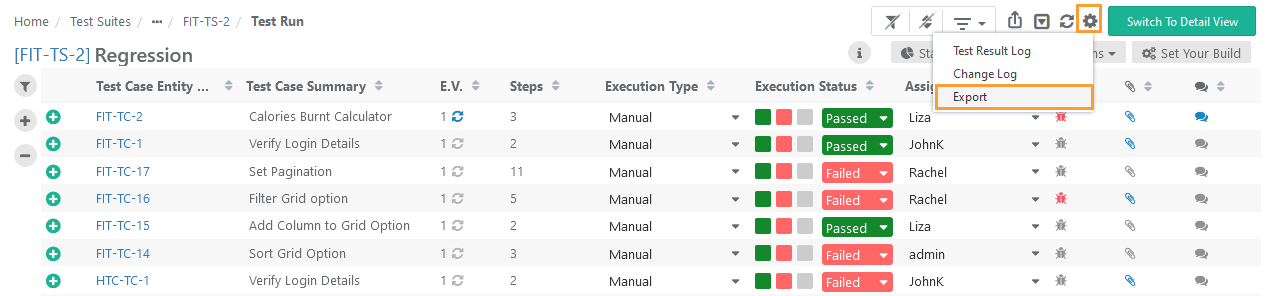
Export Test Execution
You can export test executions in Excel and PDF.
Export Test Execution to Excel
Steps
1. On the execution screen.
2. Click on the cog icon at the top right corner of the application header.
3. Select Export.
The next screen opens with the following options. Select options to export test execution.
Test Execution Export Options
- Export Test Execution with steps in multiple rows: It will export test cases with steps arranged in multiple rows of excel sheet.
- Export Test Execution with steps in single row: It will export test cases with steps included in a single cell.
- Export Test Execution without Steps: It will export test cases without steps.
Field Export Options
- Visible Fields: Select the option to export only visible fields on the screen. The export will exclude the columns which are hidden.
- All Fields: Select the option to export all the fields irrespective of whether the columns are visible or hidden.
Select Export Format
- XLSX
- CSV
4. Click Export.
Share Test Execution Runs with Other Users
Share Test Execution Runs
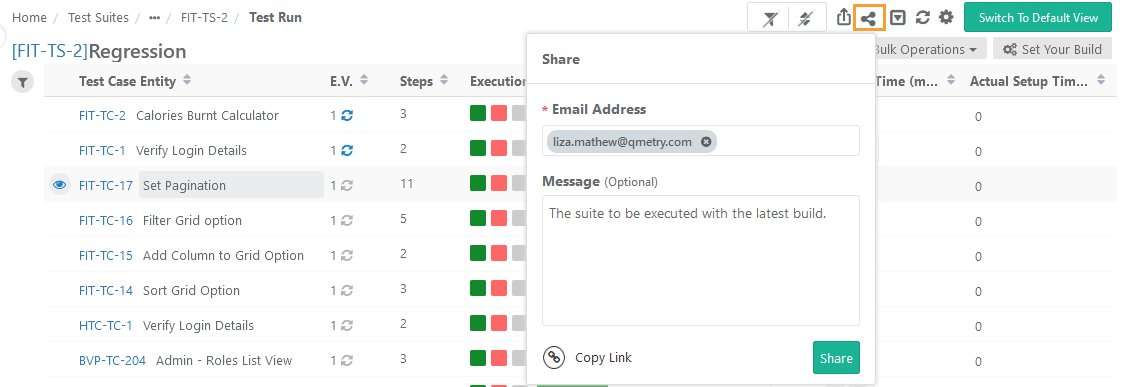
Users can share the test executions with other users over email. The recipient user will receive an email containing the asset summary with the Message written while sharing the asset and a link navigating to the particular asset. It helps the recipient users easily access the test asset.
Steps
Go to the Test Suite > Test Executions.
Click on the Share icon at the top. The Share pop-up opens.
Enter the Email Address of the user with whom you want to share the asset. You can mention multiple email addresses to share the test asset with multiple users at a time.
Enter the required message that you want to convey to the recipient of the email.
Click on the Share button.
Copy Test Asset Link
You can copy the link of the test asset to share it further with other team members. It helps you to get the specific test asset and share it with other users through email or chat. The other users with whom the link is shared can access the test asset directly from the link.
→ The following is the syntax of the URL:
https://<URL>>/#/<AssetType>/<AssetKey>
For example,
Steps
Go to the Test Suite > Test Executions.
Click on the Share icon at the top. The Share pop-up opens.
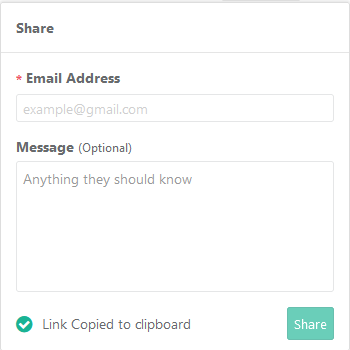
Click on the Copy Link button.
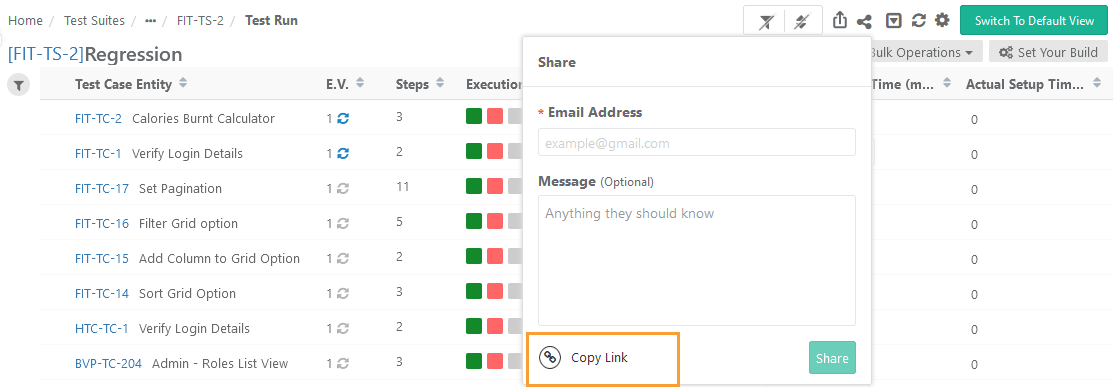
The test asset link gets copied to the clipboard. You can share this link with other team members, whom you want to work on the test asset, either through email or chat or any other communication means.
Export Test Execution to PDF
Refer to Export from Execution Screen.
Back to QMetry All Products Help Page