Requirement Report
Requirement report provides standard industry matrices used by Product Manager/Owners, Business Analysts, QA managers, Scrum Masters/Owners to get a summarized view on coverage and execution status for selected scope i.e combination of Project, Release and Cycle. The summary graphs can drill further to get the details of requirements. The fields/columns can be grouped, sorted, selected (show/hide), resized. Graphical report can be exported in PDF or PNG formats and drilled down details can be exported in Excel or CSV format.
The report can be generated for multiple projects. You can select more than one project on the drop-down.
Only one Release and Cycle can be selected at a time.
- If only Project is selected (without Release and Cycle), then the latest version of requirement will be considered in the report.
- If Release/Cycle is selected along with Project, then the requirement version associated to that Release and Cycle will be considered in the report.
Requirement reports shows the following matrices:
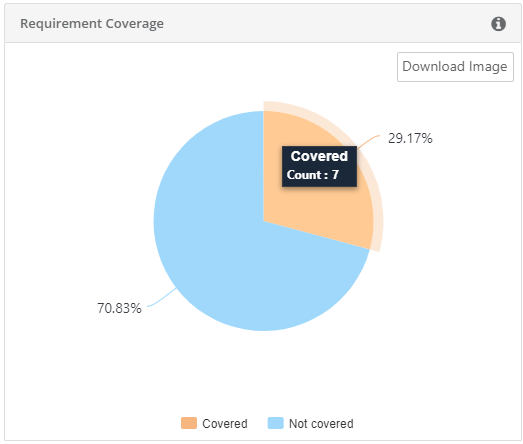
- Requirement Coverage: The report shows summary of requirements by their coverage status based on test case linkages. Requirement is covered if it is linked to one or more testcases
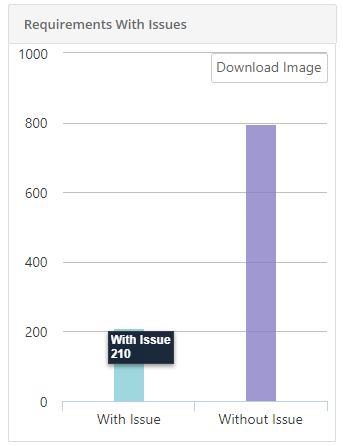
- Requirement With Issues : The report shows the summary of requirements linked to issues. This report will count issues that are linked to requirements linked.
- Planned Requirements: The report shows summary of requirements Planned or Unplanned for execution. A requirement would be considered as planned once all the test cases linked to it are added to a Test suite.

- Requirement Summary by Workflow Status/Priority : The report shows summary of requirements grouped by their workflow status / priority.

Download Chart
You can see the Download Image button on hovering over the individual charts. The download functionality makes it easier for users to save charts as images with PNG format.
Click on the Download Image button and the download process starts.
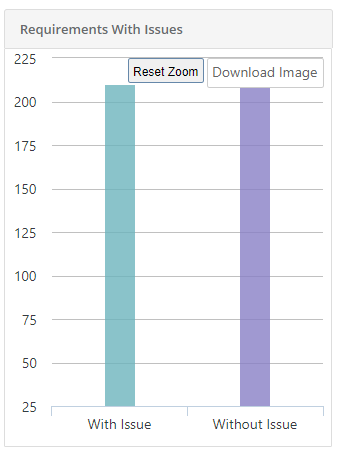
Zoom in the Bar Chart
You can zoom-in the chart view by just holding and dragging the mouse pointer to select a particular area on the chart. It enlarges that covered area on the chart and let you view more granular details. It gives you a closer look of the portion you selected on the chart.
To go back to the original view, click on the Reset Zoom button on the chart.
Drill Down the Chart
You can view the tabular format for graphical representation. Drill down the chart by clicking on the required portion/bar of the chart. The columns can be rearranged on the table as per priority in the report through the drag and drop operation.
For example, we drill down the Requirements with Issues chart by clicking on the "With Issue" bar.
It displays the details in table - rows and columns.
You can see two icons there: a) Export icon, b) Con icon.
A) Export Chart: The chart can be exported either in Excel or CSV format.
B) Con icon has the following options on it:
- Hide/Show Columns
- Sort records
- Group record details

Hide and Show Columns
The column names are displayed with check box pre-fixed to them. Select the column you want to show on the table. Columns not selected will remain hidden.
Sort Report Records
You can sort rows by column values. Select the column on which the rows will be sorted and the direction thereof.

Group Records by Column
You can organize rows by grouping them on particular column.
- Grouping Column: Select the column you want to group the rows on.
- Exclude Detail Rows: If the checkbox is selected, then the rows under the group heading will not be displayed. Only groups will be displayed.

Schedule Emails to Send Reports
You can share updated reports on regular basis to stakeholders. QMetry offers the flexibility to schedule emails that will contain PDF of report details.
To schedule outbound emails at particular frequency, click on the Schedule button for the report that you want to share. The report details will be sent in PDF to recipients as per defined schedule.

The Schedule icon turns green as soon as the email is scheduled.
Scheduler History: The Scheduler History button is located adjacent to the Scheduler button. Click on the Scheduler History button to view the history of scheduled reports.